
B2B content strategies that win on LinkedIn
We analyzed 1,680 posts from 168 B2B companies to find what actually earns engagement.

Your report is here.
Thanks for your interest. Your PDF is ready to download now.
Download the PDFA preview of what we found.
What you'll get.
15 pages, written for B2B marketing leaders and the teams behind company LinkedIn pages.
The 168 companies, the three-month window and how every post was classified and scored.
The six numbers that matter most, on one page.
Quality, structure, text, links, case studies, data, visuals, questions, timing and people, each with an exhibit.
Eight practical moves, each tied to a finding.
What sits underneath the study: company snapshots and the full post analysis.
See the pages, and why we built them that way.
Real pages from the report, each with a short note on what it shows, why we designed it that way and what you take away from it.
Click to enlargeOur study of what B2B companies post on LinkedIn, and what earns a response.
This report analyzes 1,680 LinkedIn posts from 168 B2B companies, ten per company, collected from May to July 2024. 26 Characters content strategists classified every post and scored it on engagement and on qualities such as structure, creativity and relevance.
 Click to enlarge
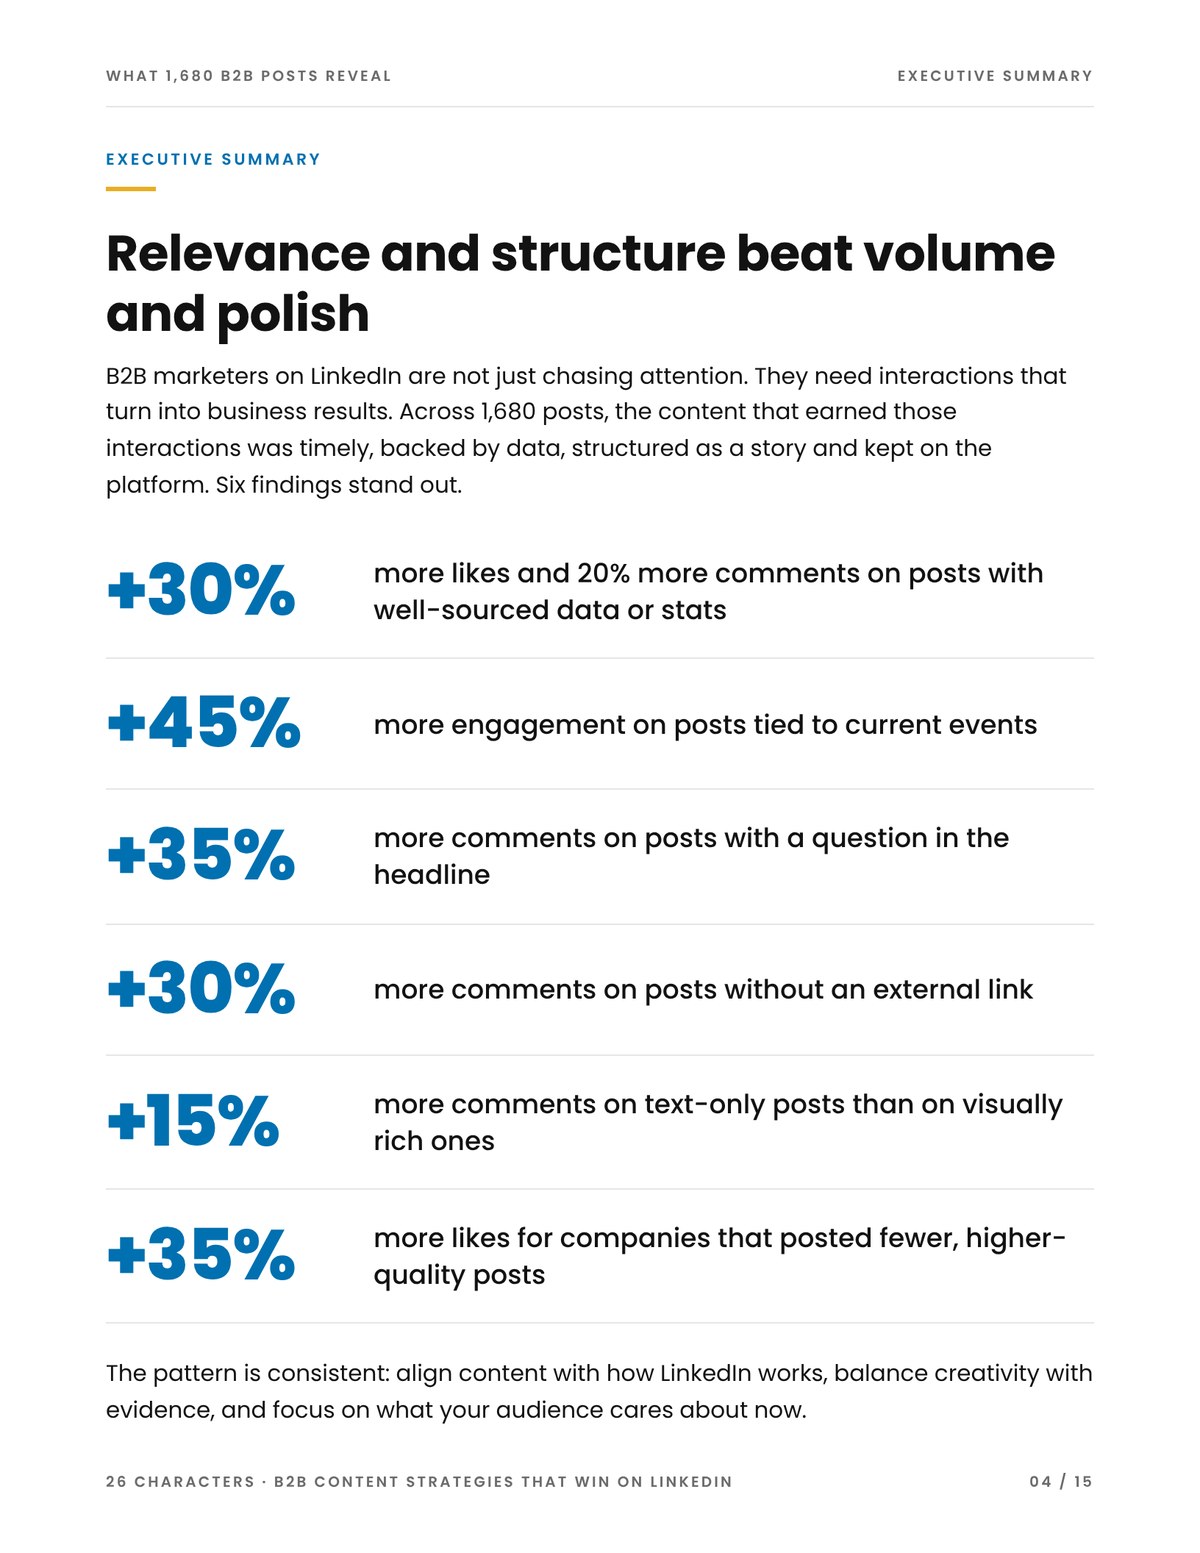
Timely, data-backed and link-free posts start more conversations than visually rich ones.
The executive summary puts six findings up front. Posts with well-sourced data drew 30% more likes, posts tied to current events earned 45% more engagement, question headlines drew 35% more comments, link-free posts drew 30% more comments and text-only posts drew 15% more comments than visually rich ones.
 Click to enlarge
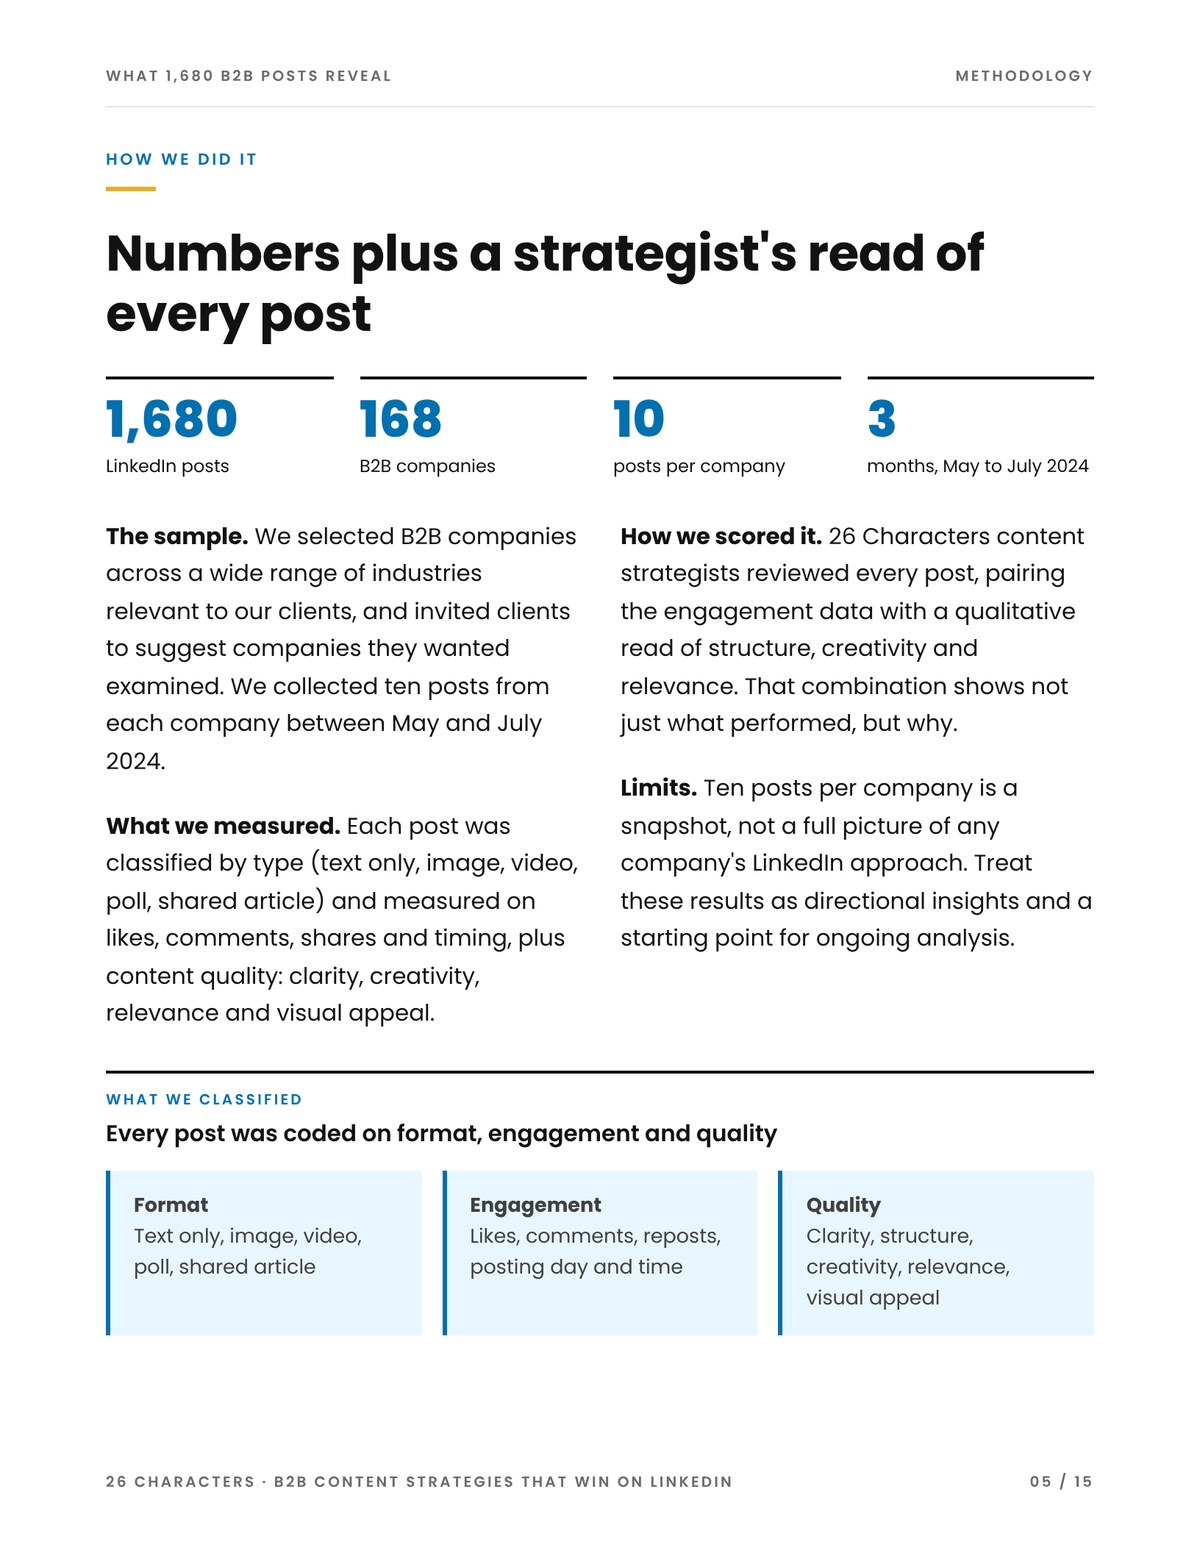
We paired engagement numbers with a strategist's read of every post.
The methodology page lays out the sample and its limits. Each post was classified by format, from text-only to images, videos, polls and shared articles, then measured on likes, comments, reposts, timing and content quality. Ten posts per company is a snapshot, so we treat the results as directional and a starting point for ongoing analysis.
 Click to enlarge
Ten findings, each backed by an exhibit you can act on.
Each findings page pairs the headline result with an exhibit and a real example. Findings 1 and 2 show that companies posting fewer, higher-quality pieces earned 35% more likes, and that a clear structure (bold claim, supporting data, call to action) lifted comments by 20%, whatever the format.
 Click to enlarge
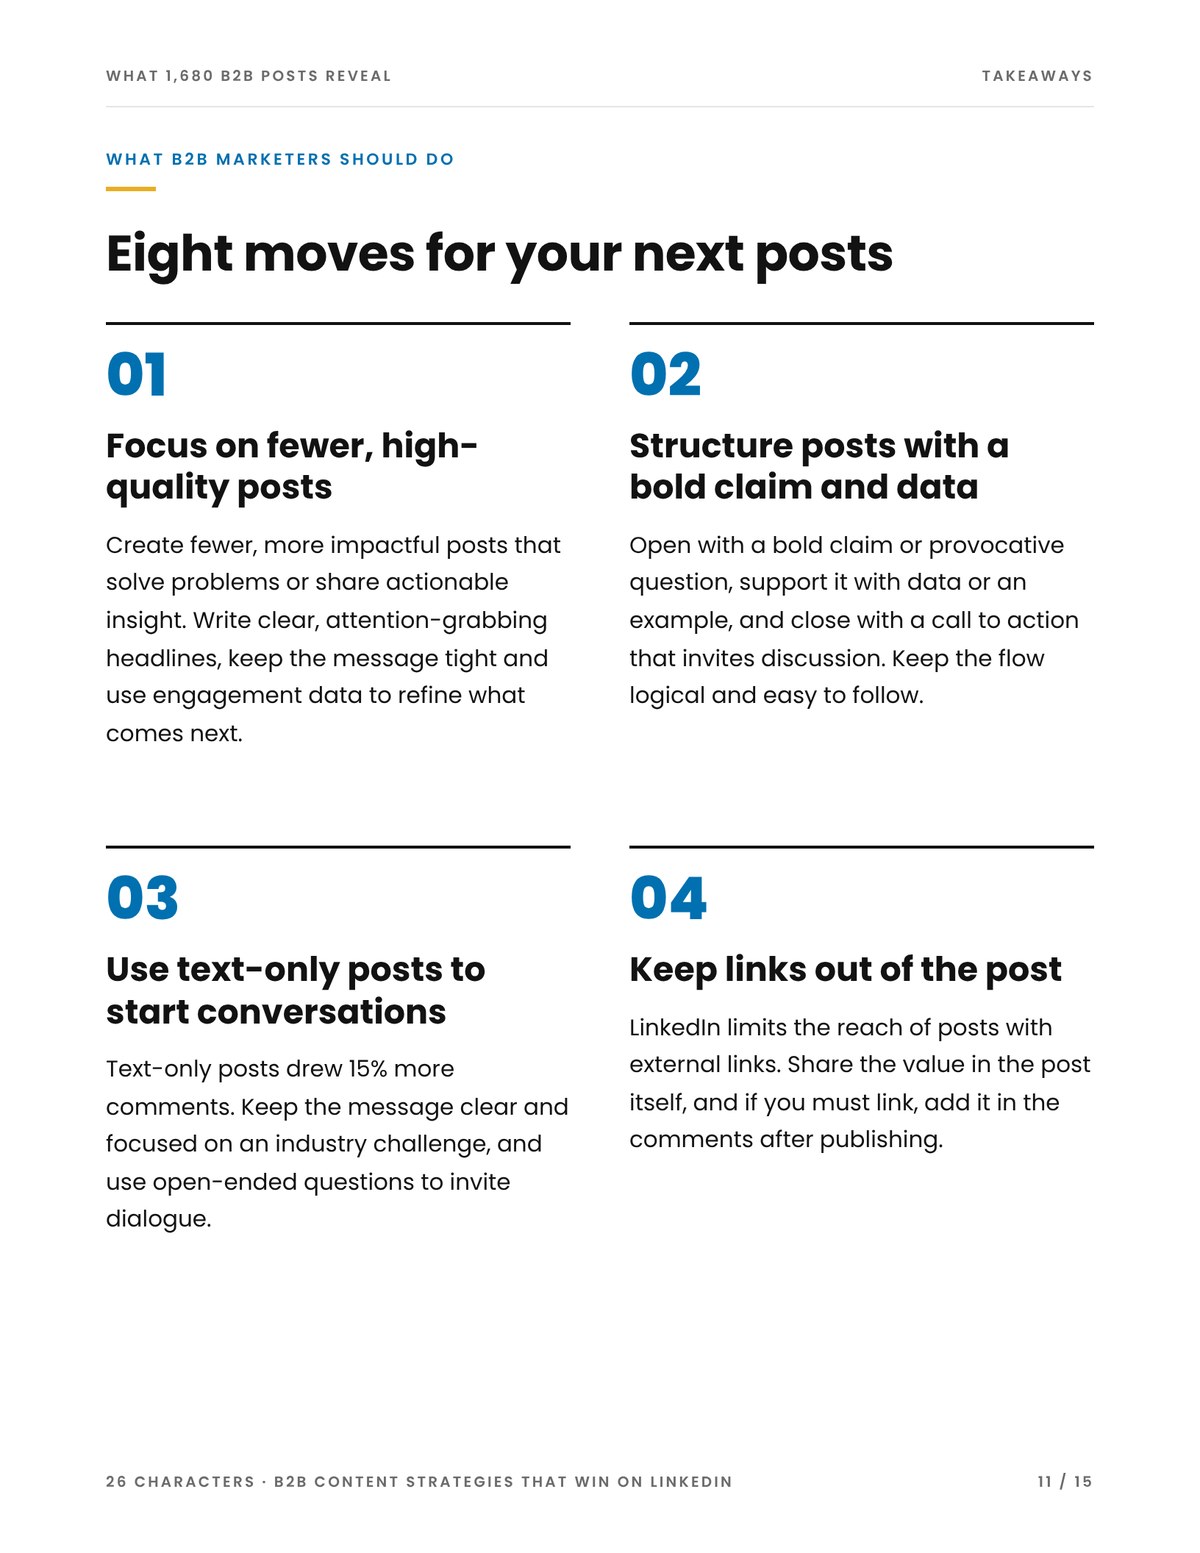
Every finding becomes a move you can make on your next post.
The report closes with eight practical moves. Post fewer, higher-quality pieces. Open with a bold claim or question, back it with data and end with a call to action. Keep the value in the post itself, and if you must share a link, add it in the comments after publishing.
Other free reports.
Connect with 26 Characters.
Want to see how your company's LinkedIn measures up? Start with a free diagnostic.