
What 1,372 CEO posts reveal: the state of B2B CEO LinkedIn 2026
We read six months of LinkedIn posts from 109 CEOs of the largest US B2B companies and coded all 1,372 on 34 variables. Most of the feed is company news. The posts buyers value most are the rarest.

Your report is here.
Thanks for your interest. Your PDF is ready to download now.
Download the PDFA preview of what we found.
What you'll get.
156 pages, written for B2B marketing leaders and the teams behind executive LinkedIn.
Who we studied, the six-month window and the 34 things we measured on every post.
Ten findings on what CEOs post, how they sound, what they leave out and what audiences reward.
Every measure in full, plus how six industries compare and breakdowns by revenue, followers and posting frequency.
The 54 CEOs with 10 or more posts, one page each, with their numbers and example posts.
How we tested the results, how the study was run and what it cannot say.
See the pages, and why we built them that way.
Real pages from the report, each with a short note on what it shows, why we designed it that way and what you take away from it.
 Click to enlarge
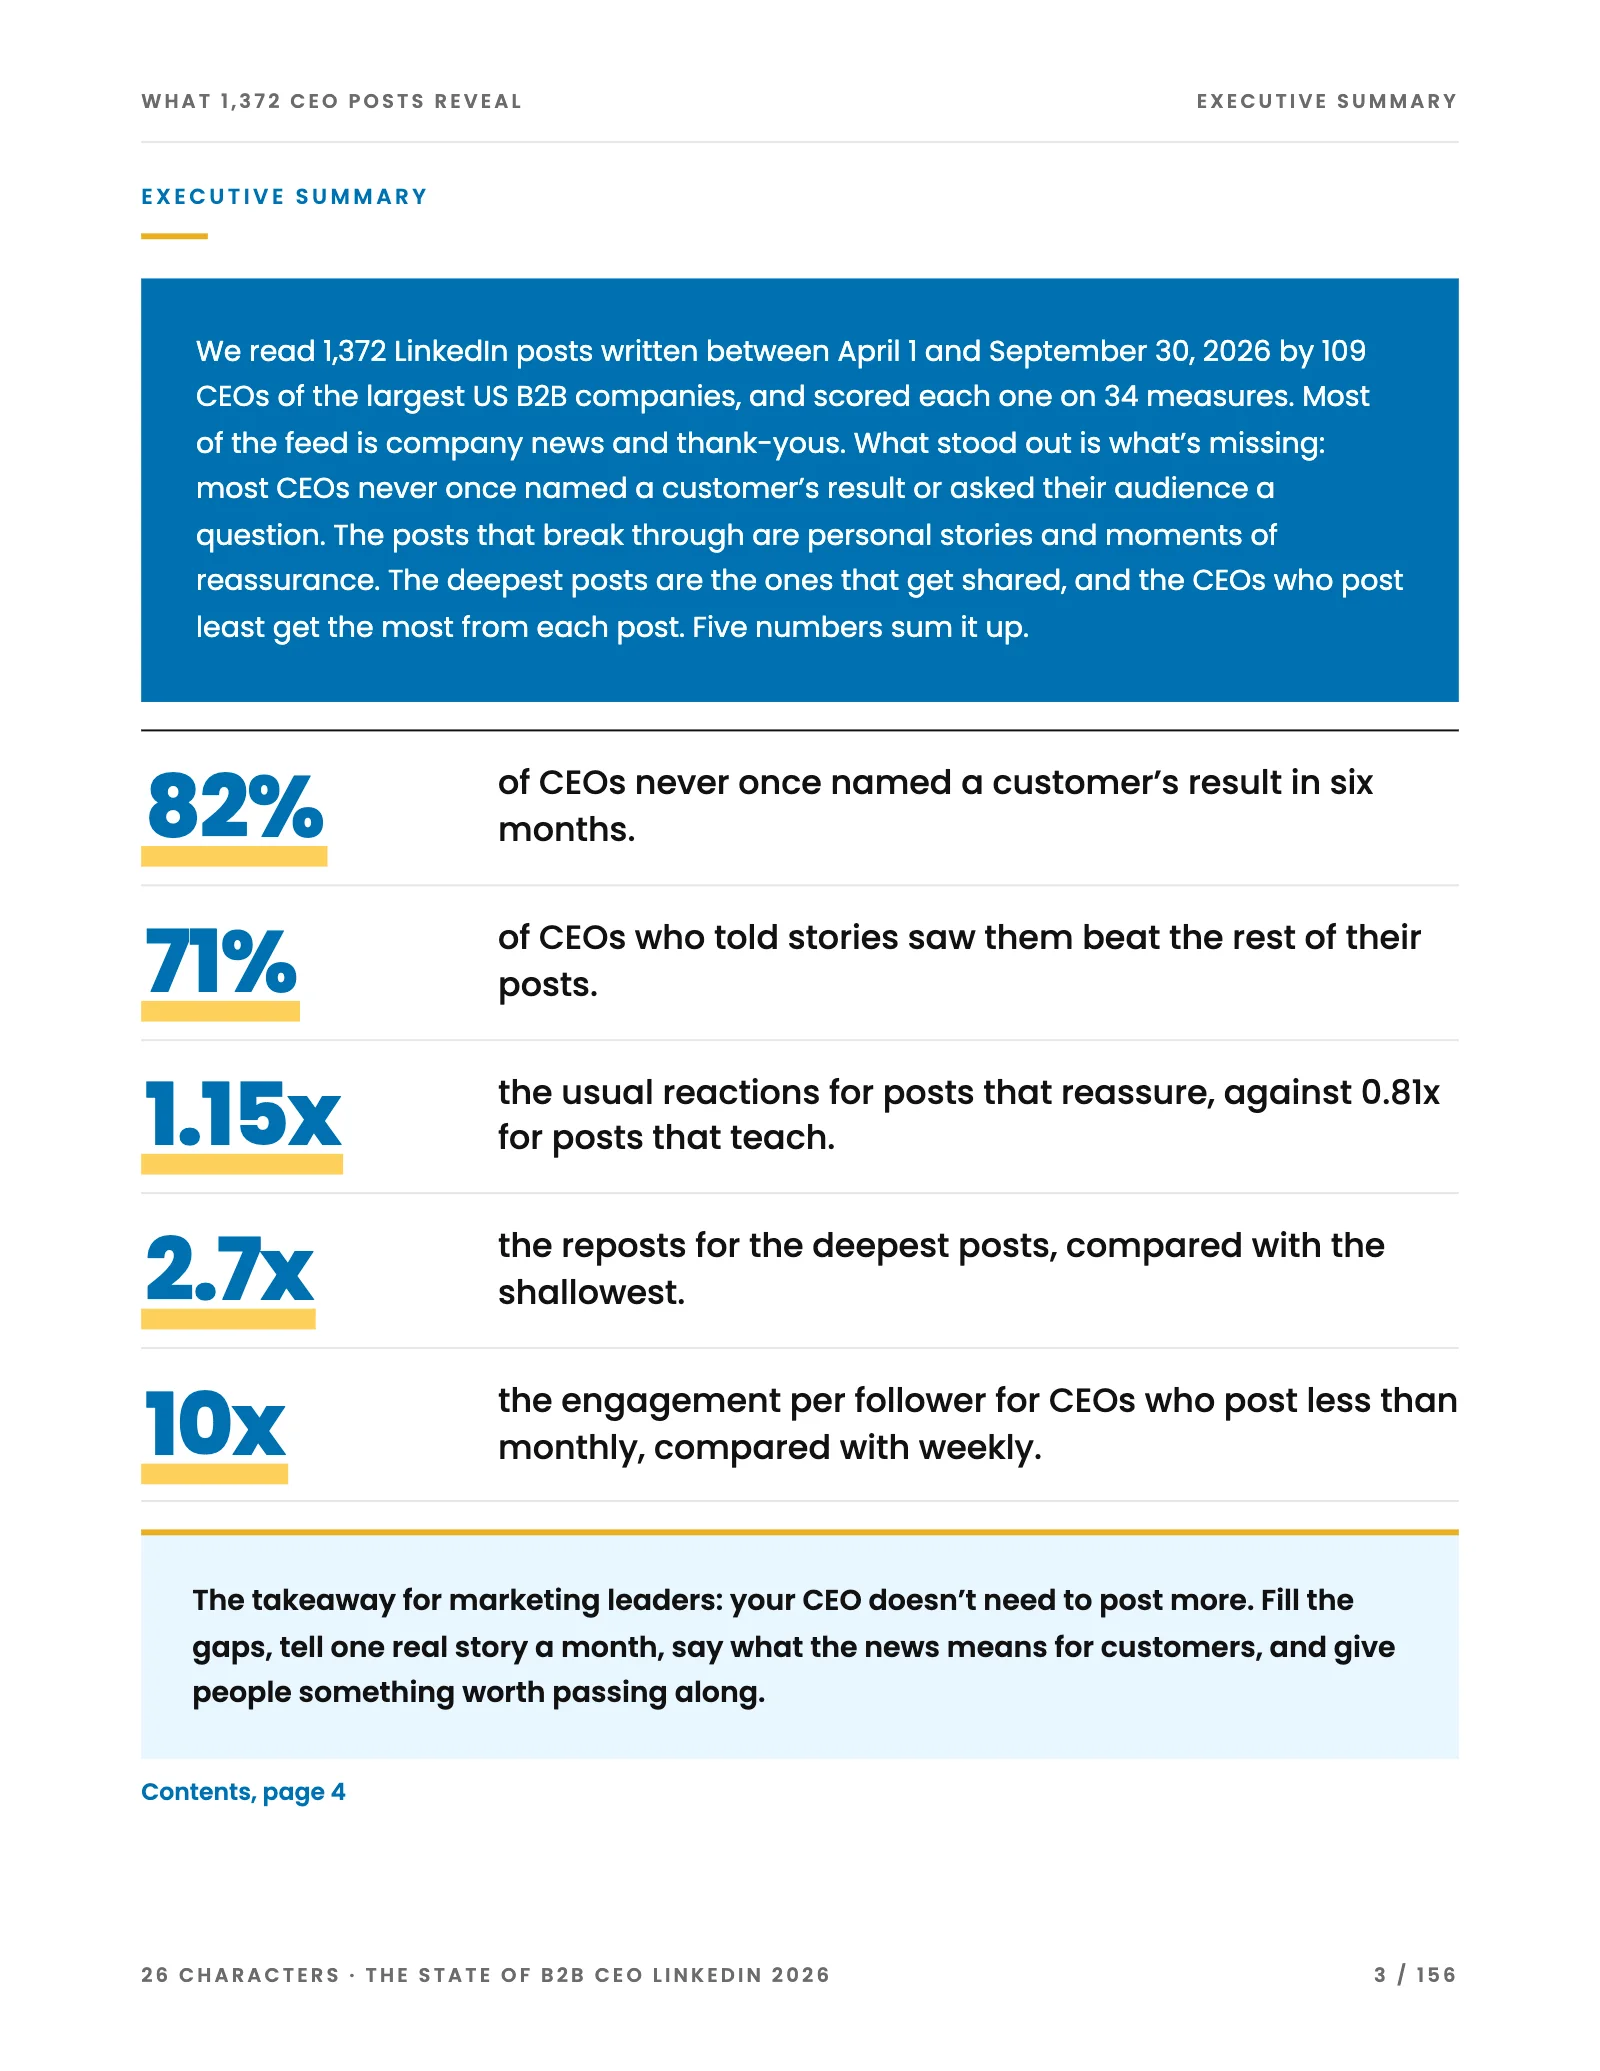
Most CEO feeds are company news and thank-yous, and the posts buyers value most are missing.
We read 1,372 LinkedIn posts written between April 1 and September 30, 2026 by 109 CEOs of the largest US B2B companies, and scored each one on 34 measures. The executive summary boils the study down to five numbers. The sharpest: 82% of CEOs never once named a customer's result in six months, and CEOs who post less than monthly drew 10 times the engagement per follower of weekly posters.
 Click to enlarge
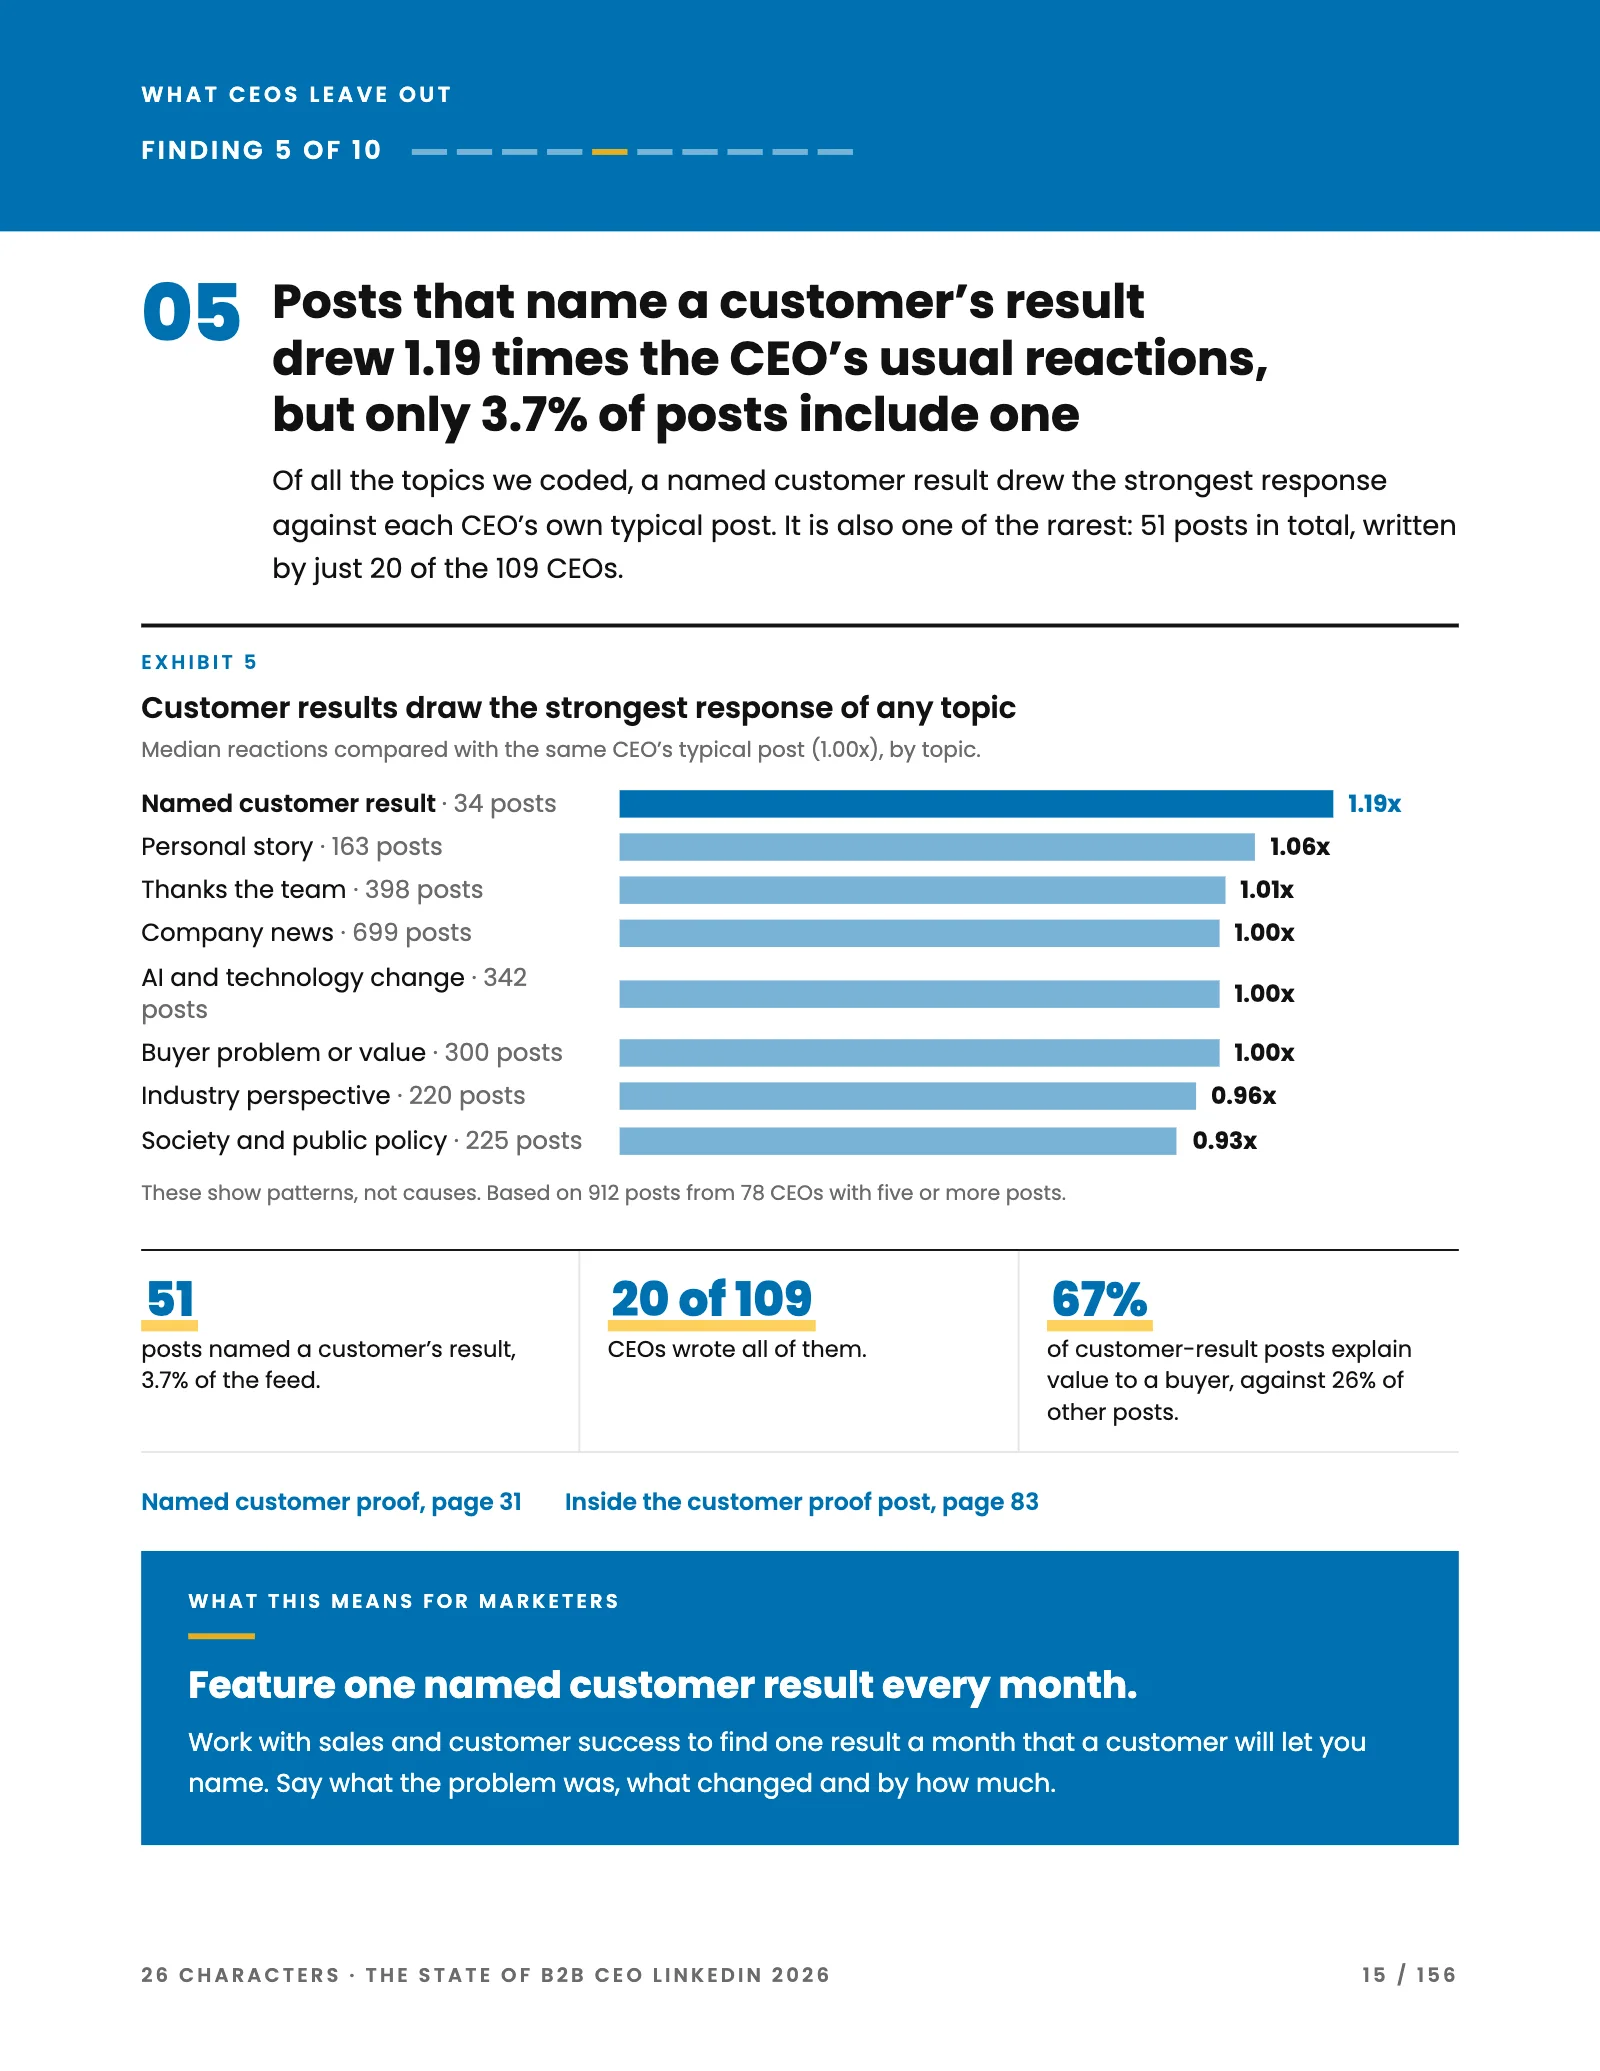
A named customer result drew the strongest response of any topic, yet only 3.7% of posts include one.
Each of the ten findings gets one page: a plain statement, an exhibit and a note on what it means for marketers. This exhibit compares each topic's median reactions with the same CEO's typical post, so a CEO with a huge following cannot skew the result. Customer results drew 1.19 times the usual reactions, but just 20 of the 109 CEOs wrote all 51 of them. The page closes with a practical step: feature one named customer result every month.
 Click to enlarge
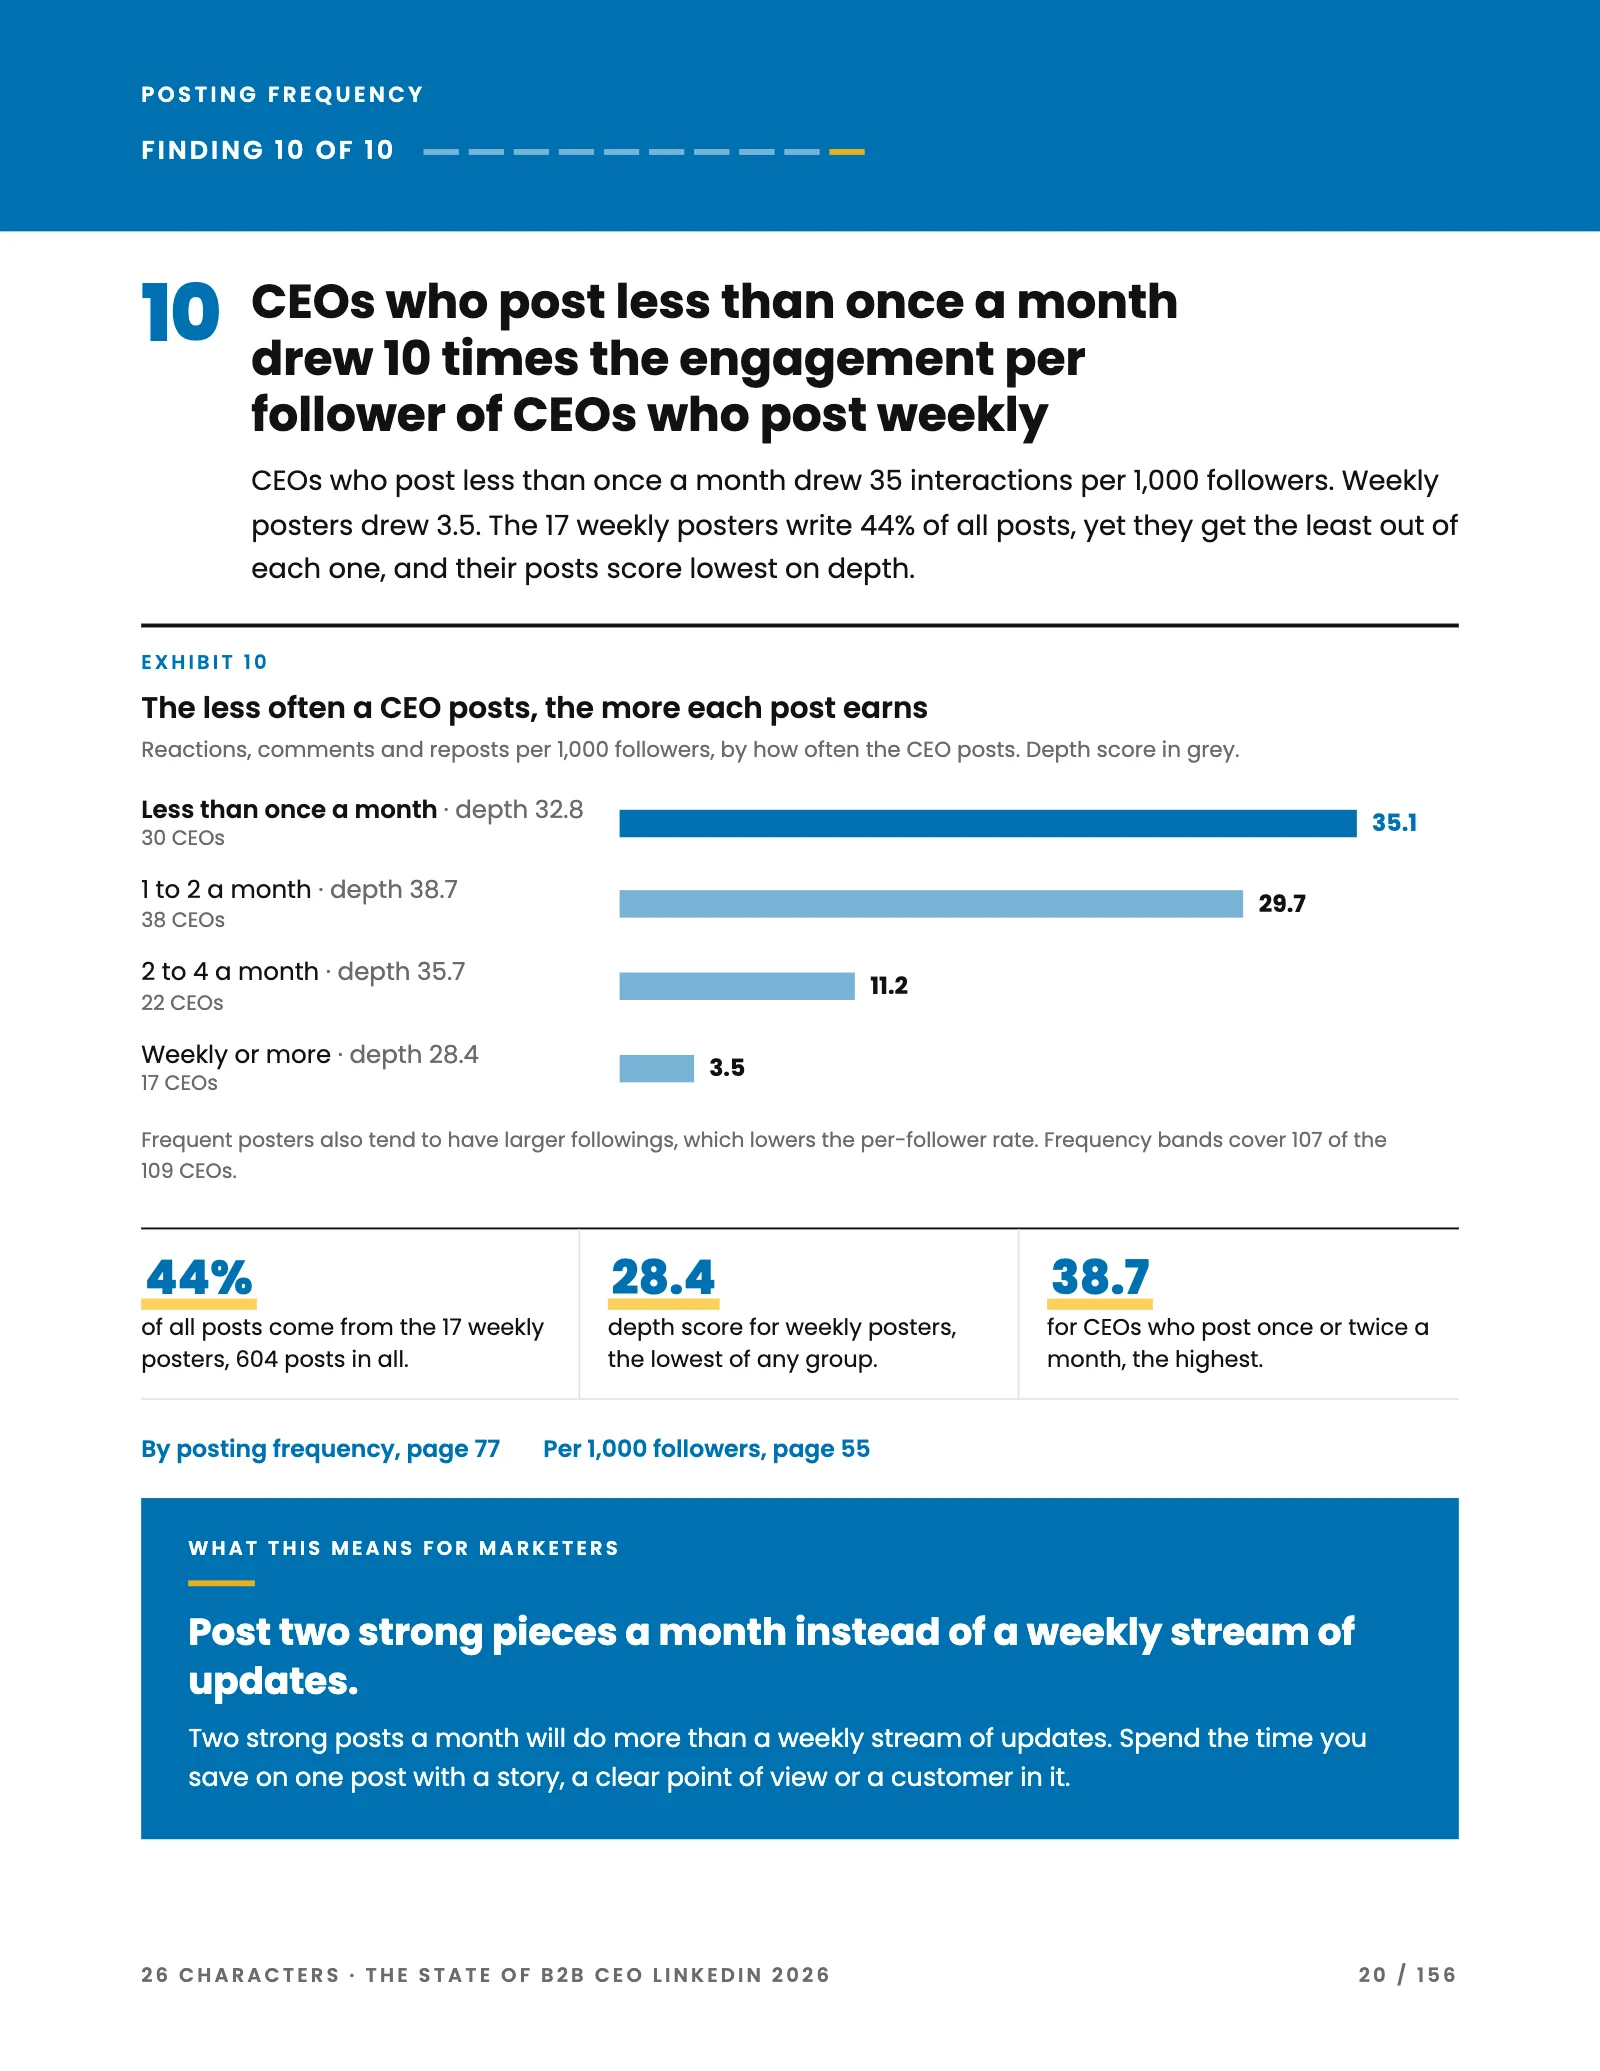
CEOs who post less than once a month earn 10 times the engagement per follower of weekly posters.
This finding splits the CEOs by how often they post. Those posting less than monthly drew 35 interactions per 1,000 followers, against 3.5 for weekly posters, even though the 17 weekly posters write 44% of all posts. A depth score sits beside each bar: weekly posters score lowest at 28.4, against 38.7 for CEOs who post once or twice a month. The page also flags that frequent posters tend to have larger followings, which lowers the per-follower rate.
 Click to enlarge
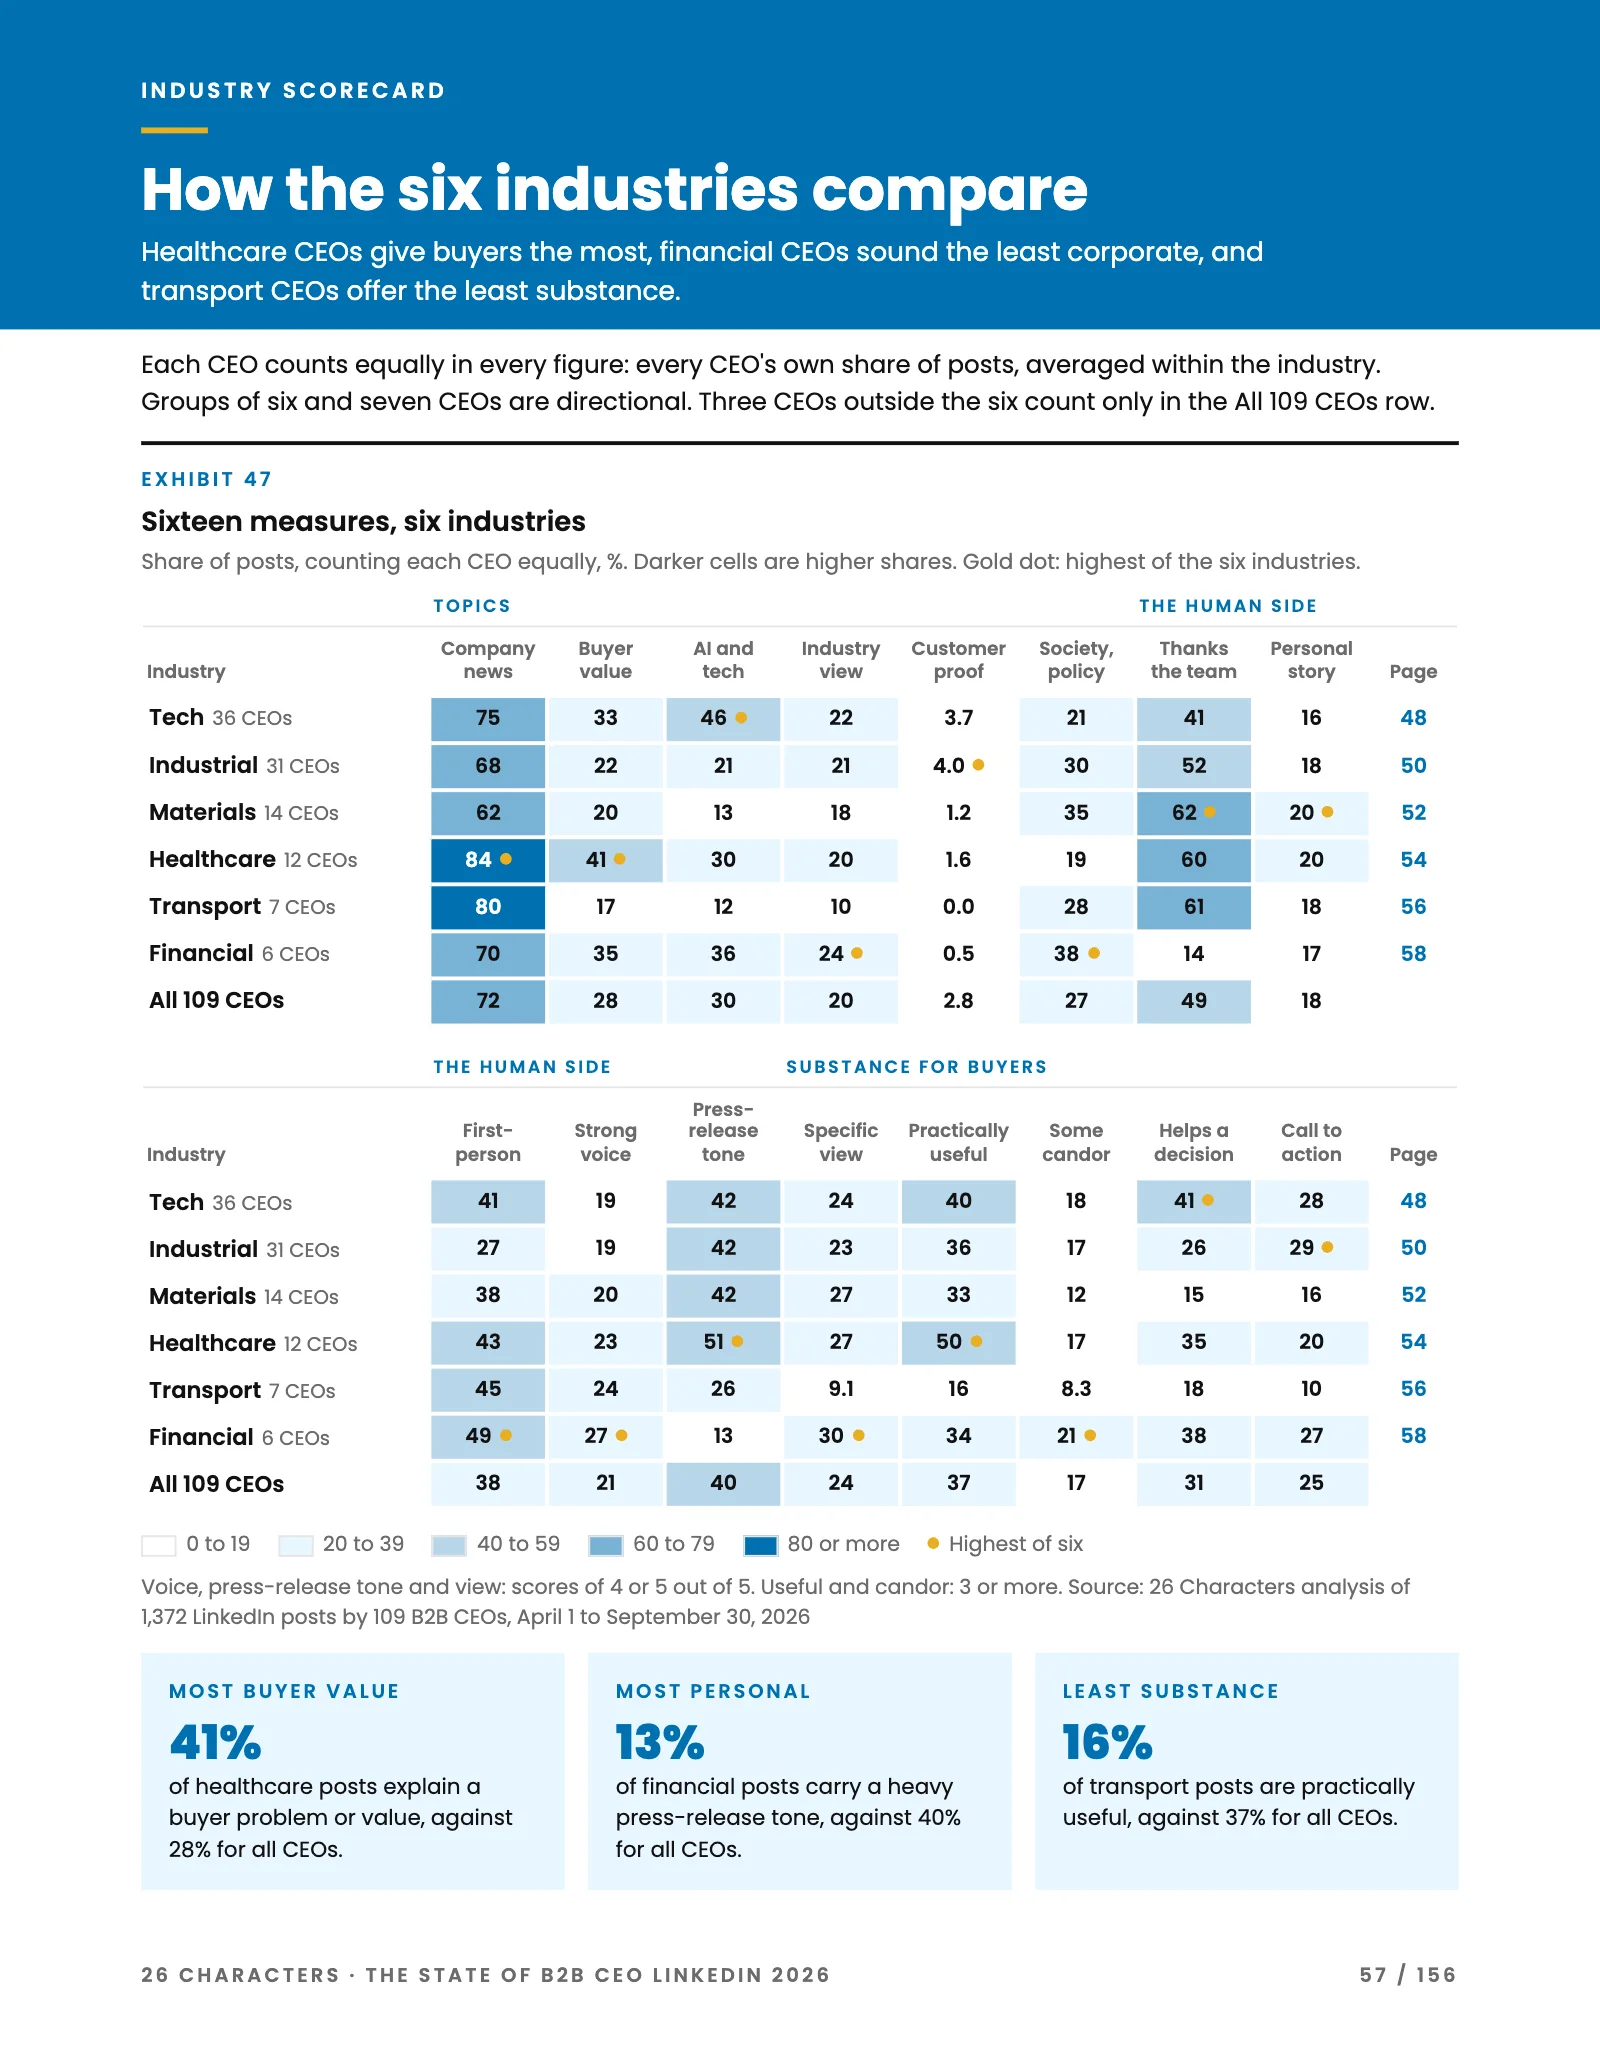
Splitting the CEOs into six industries shows who gives buyers the most and who gives them the least.
The industry scorecard compares Tech, Industrial, Materials, Healthcare, Transport and Financial CEOs on sixteen measures, and every CEO counts equally so one prolific poster cannot tilt an industry. Healthcare CEOs explain a buyer problem or value in 41% of posts, against 28% for all CEOs. Financial CEOs sound the least corporate, with a heavy press-release tone in 13% of posts against 40%, while only 16% of transport posts are practically useful, against 37%. Groups of six and seven CEOs are small, so we label those results directional.
Other free reports.
Connect with 26 Characters.
Want to see how your CEO’s LinkedIn measures up? Start with a free diagnostic.