
The Proof Gap: the state of B2B case studies
We read the newest case study from 200 established B2B companies across nine industries and coded each one on 42 elements. Most case studies already hold proof that never gets used.
Your report is here.
Thanks for your interest. Your PDF is ready to download now.
Download the PDFA preview of what we found.
What you'll get.
40 pages, written for B2B marketing and sales leaders.
The 200 companies, the nine industries and the 42 elements we coded.
What most case studies include, and what they leave out.
Why the strongest result so often ends up in a sidebar.
How often the vendor outshines the customer, and why it matters.
A practical checklist for the case studies you already have.
See the pages, and why we built them that way.
Real pages from the report, each with a short note on what it shows, why we designed it that way and what you take away from it.
 Click to enlarge
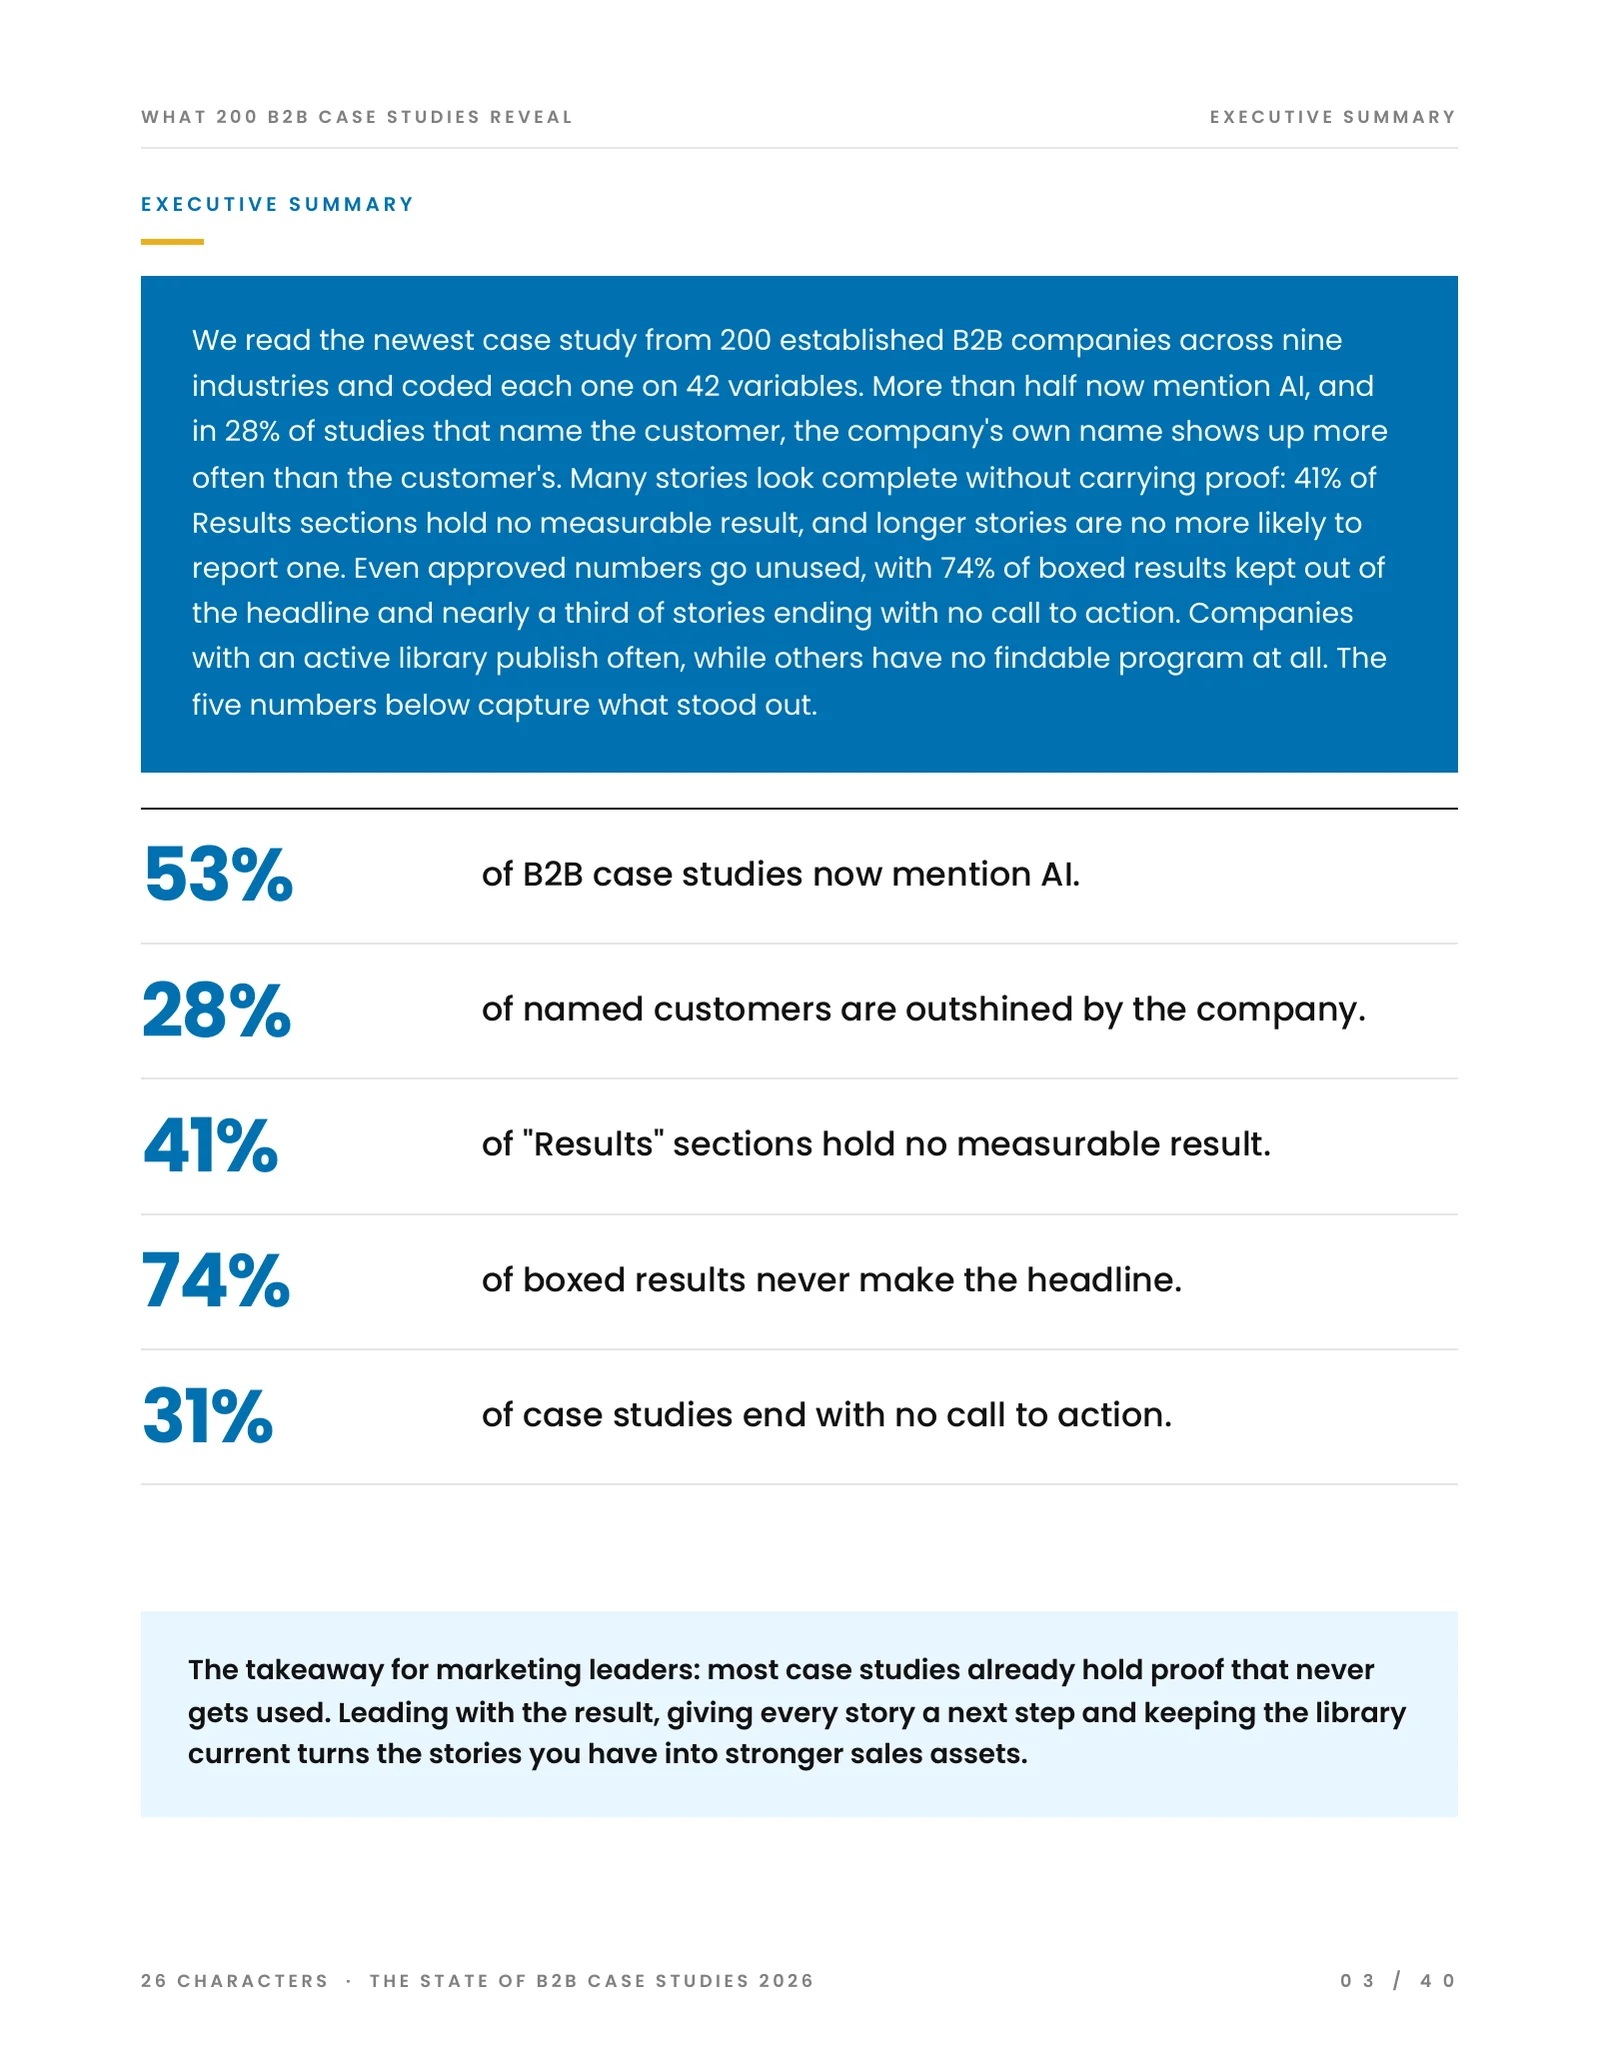
Five numbers show where B2B case studies lose their proof.
We read the newest case study from 200 established B2B companies across nine industries and coded each one on 42 variables. The executive summary puts the whole study on one page. 41% of Results sections hold no measurable result, 74% of boxed results never make the headline and 31% of case studies end with no call to action. And in 28% of studies that name the customer, the company's own name appears more often than the customer's.
 Click to enlarge
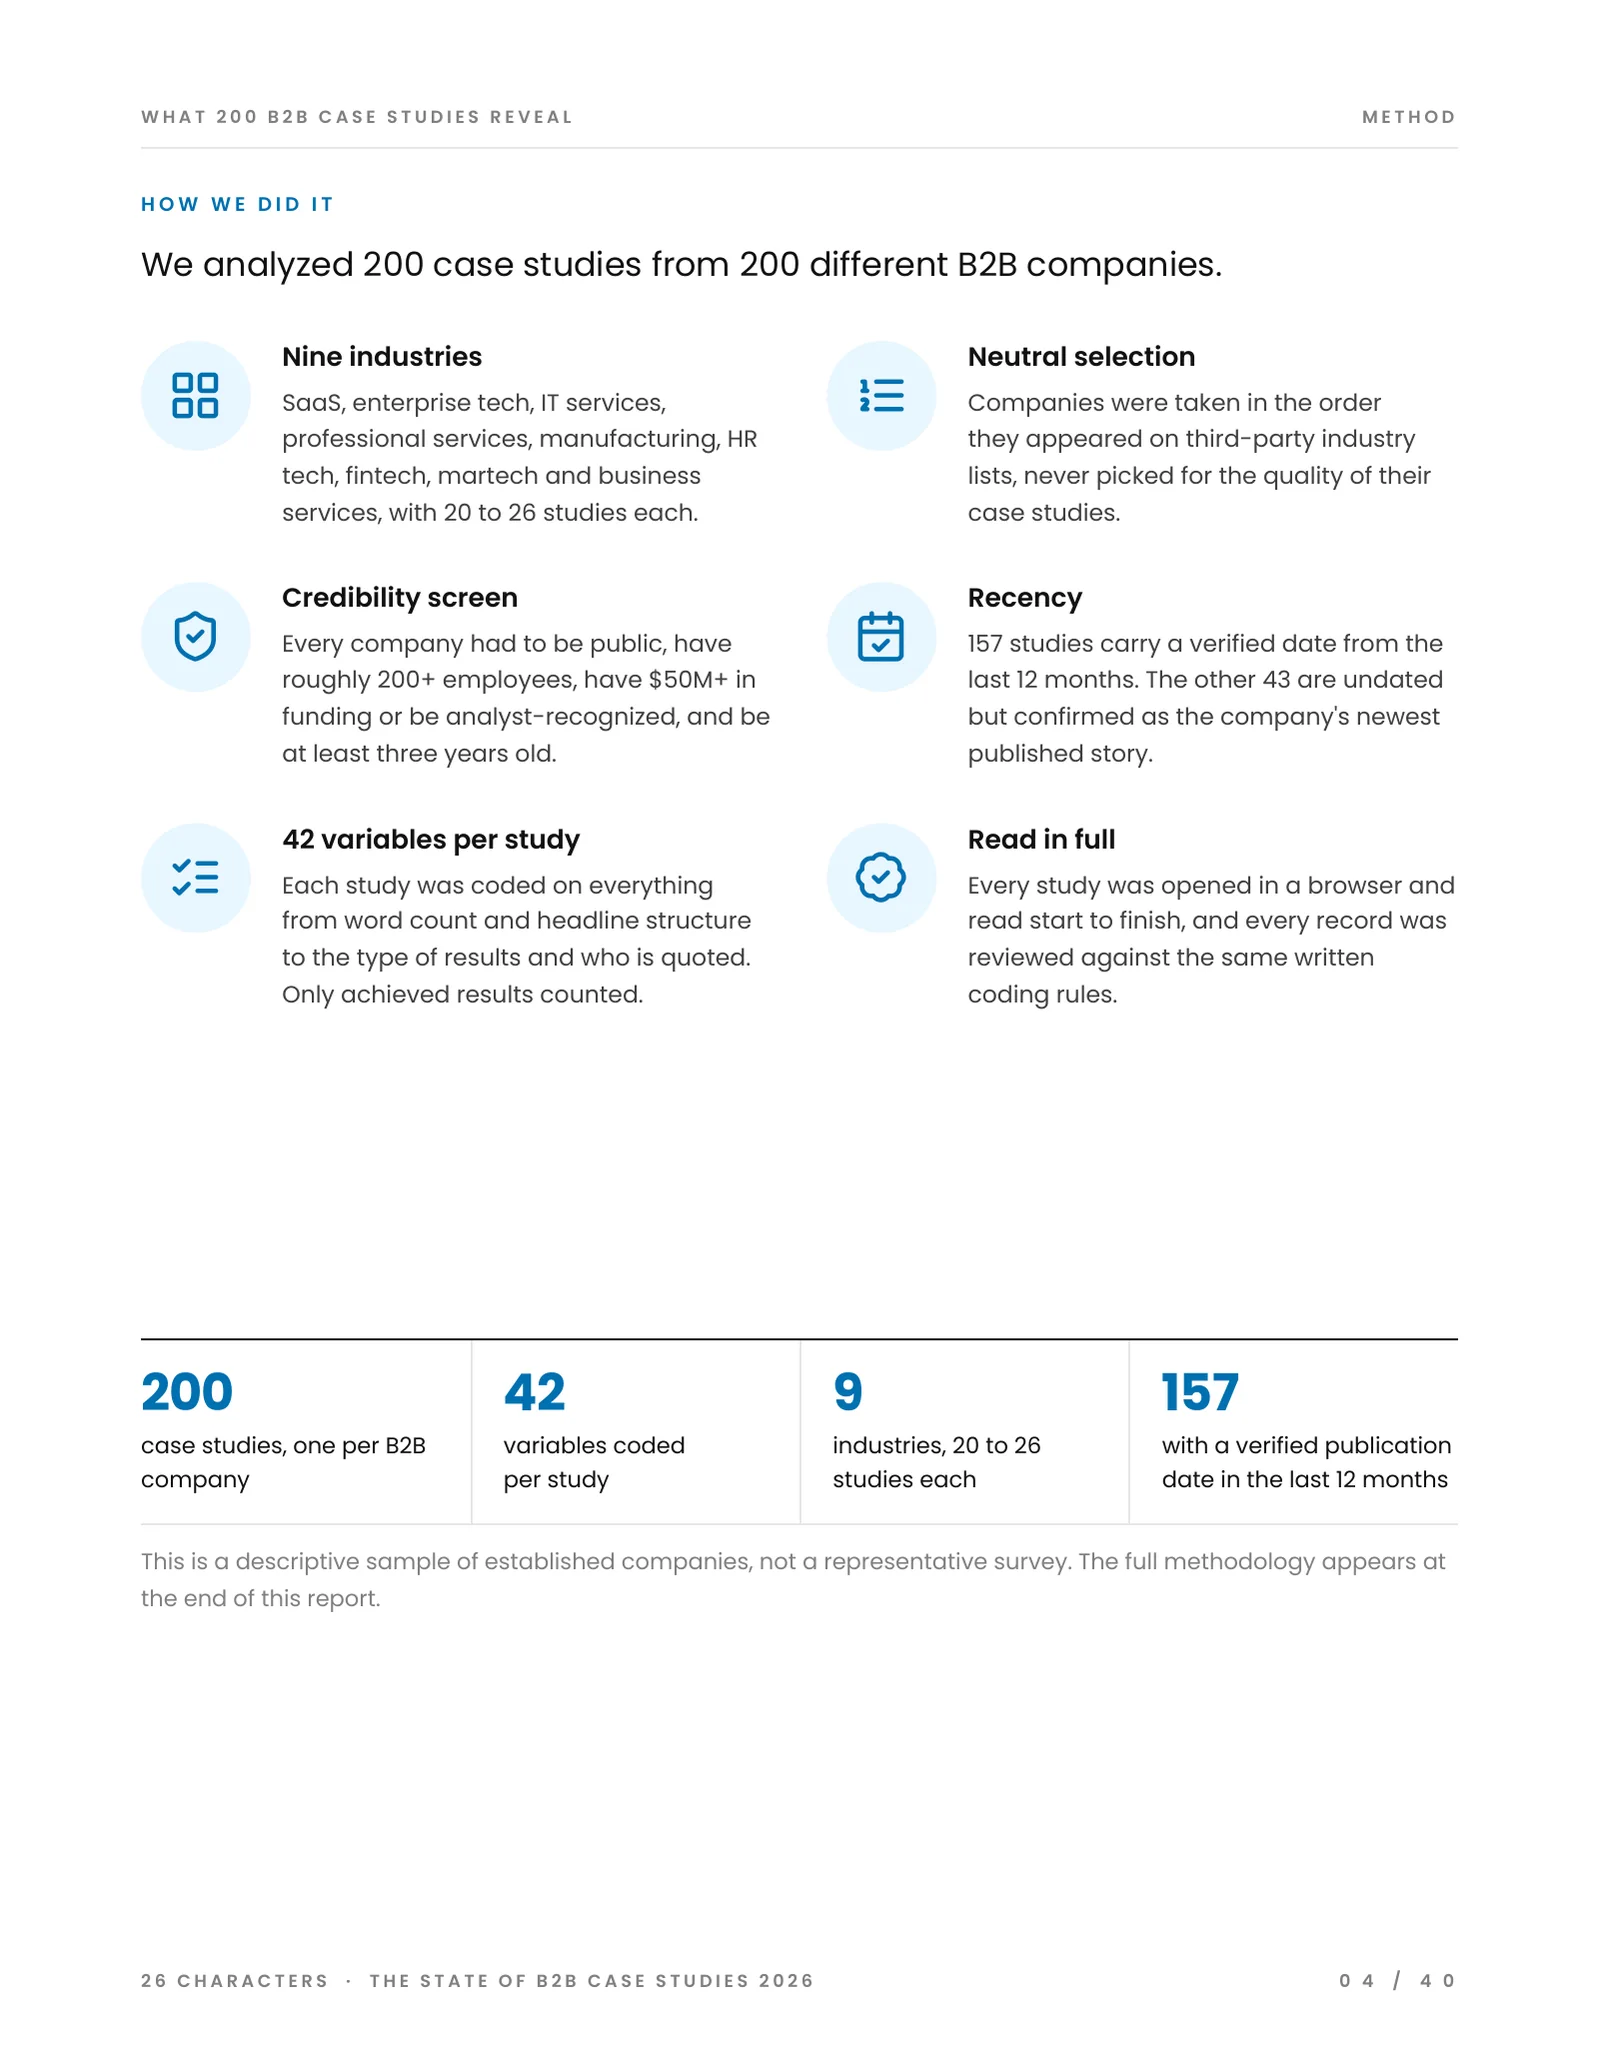
We took companies in list order, so none was picked for having good case studies.
Every company had to be public, have roughly 200 or more employees, have $50M or more in funding or analyst recognition, and be at least three years old. Each of the nine industries holds 20 to 26 studies, and every study was opened in a browser and read start to finish against the same written coding rules. 157 of the 200 carry a verified publication date from the last 12 months, and the page says plainly that this is a descriptive sample, not a representative survey.
 Click to enlarge
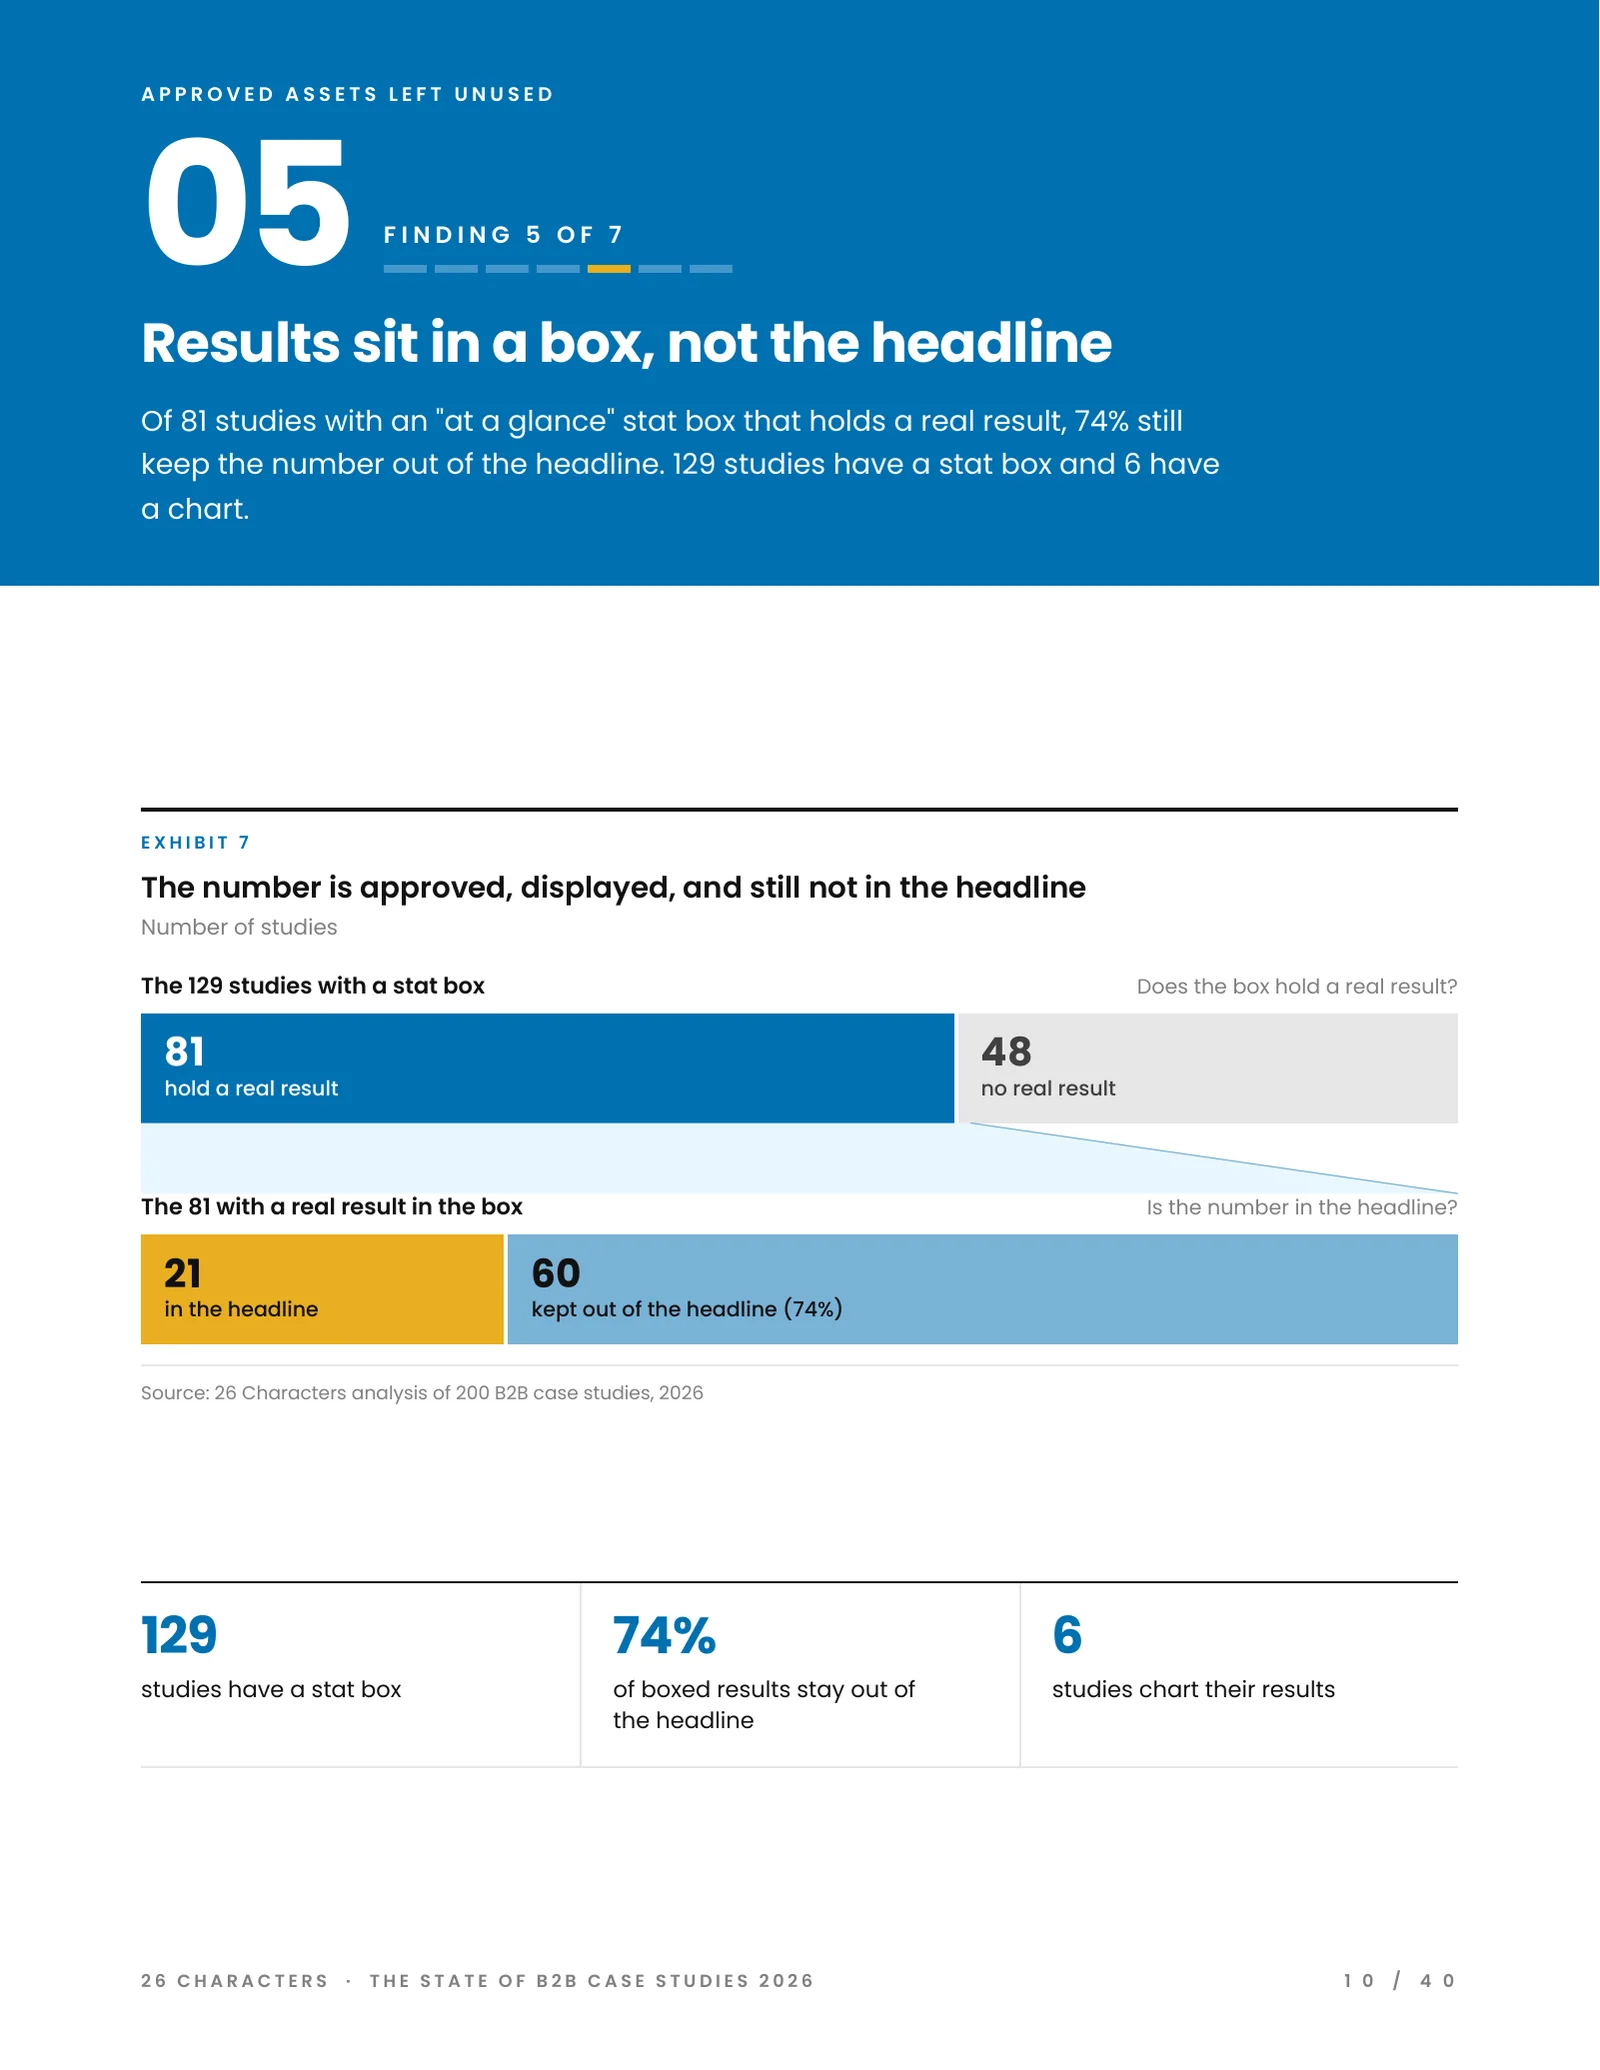
The strongest number is often approved, boxed and still kept out of the headline.
Each of the seven findings gets its own page and an exhibit that walks through the numbers. Of the 129 studies with an at a glance stat box, 81 hold a real result, and 60 of those 81 keep the number out of the headline. We drew it as two split bars so you can see exactly where the proof drops away. Moving that number into the headline needs no extra approval from the customer.
 Click to enlarge
We cut the findings by industry because what customers will approve differs from sector to sector.
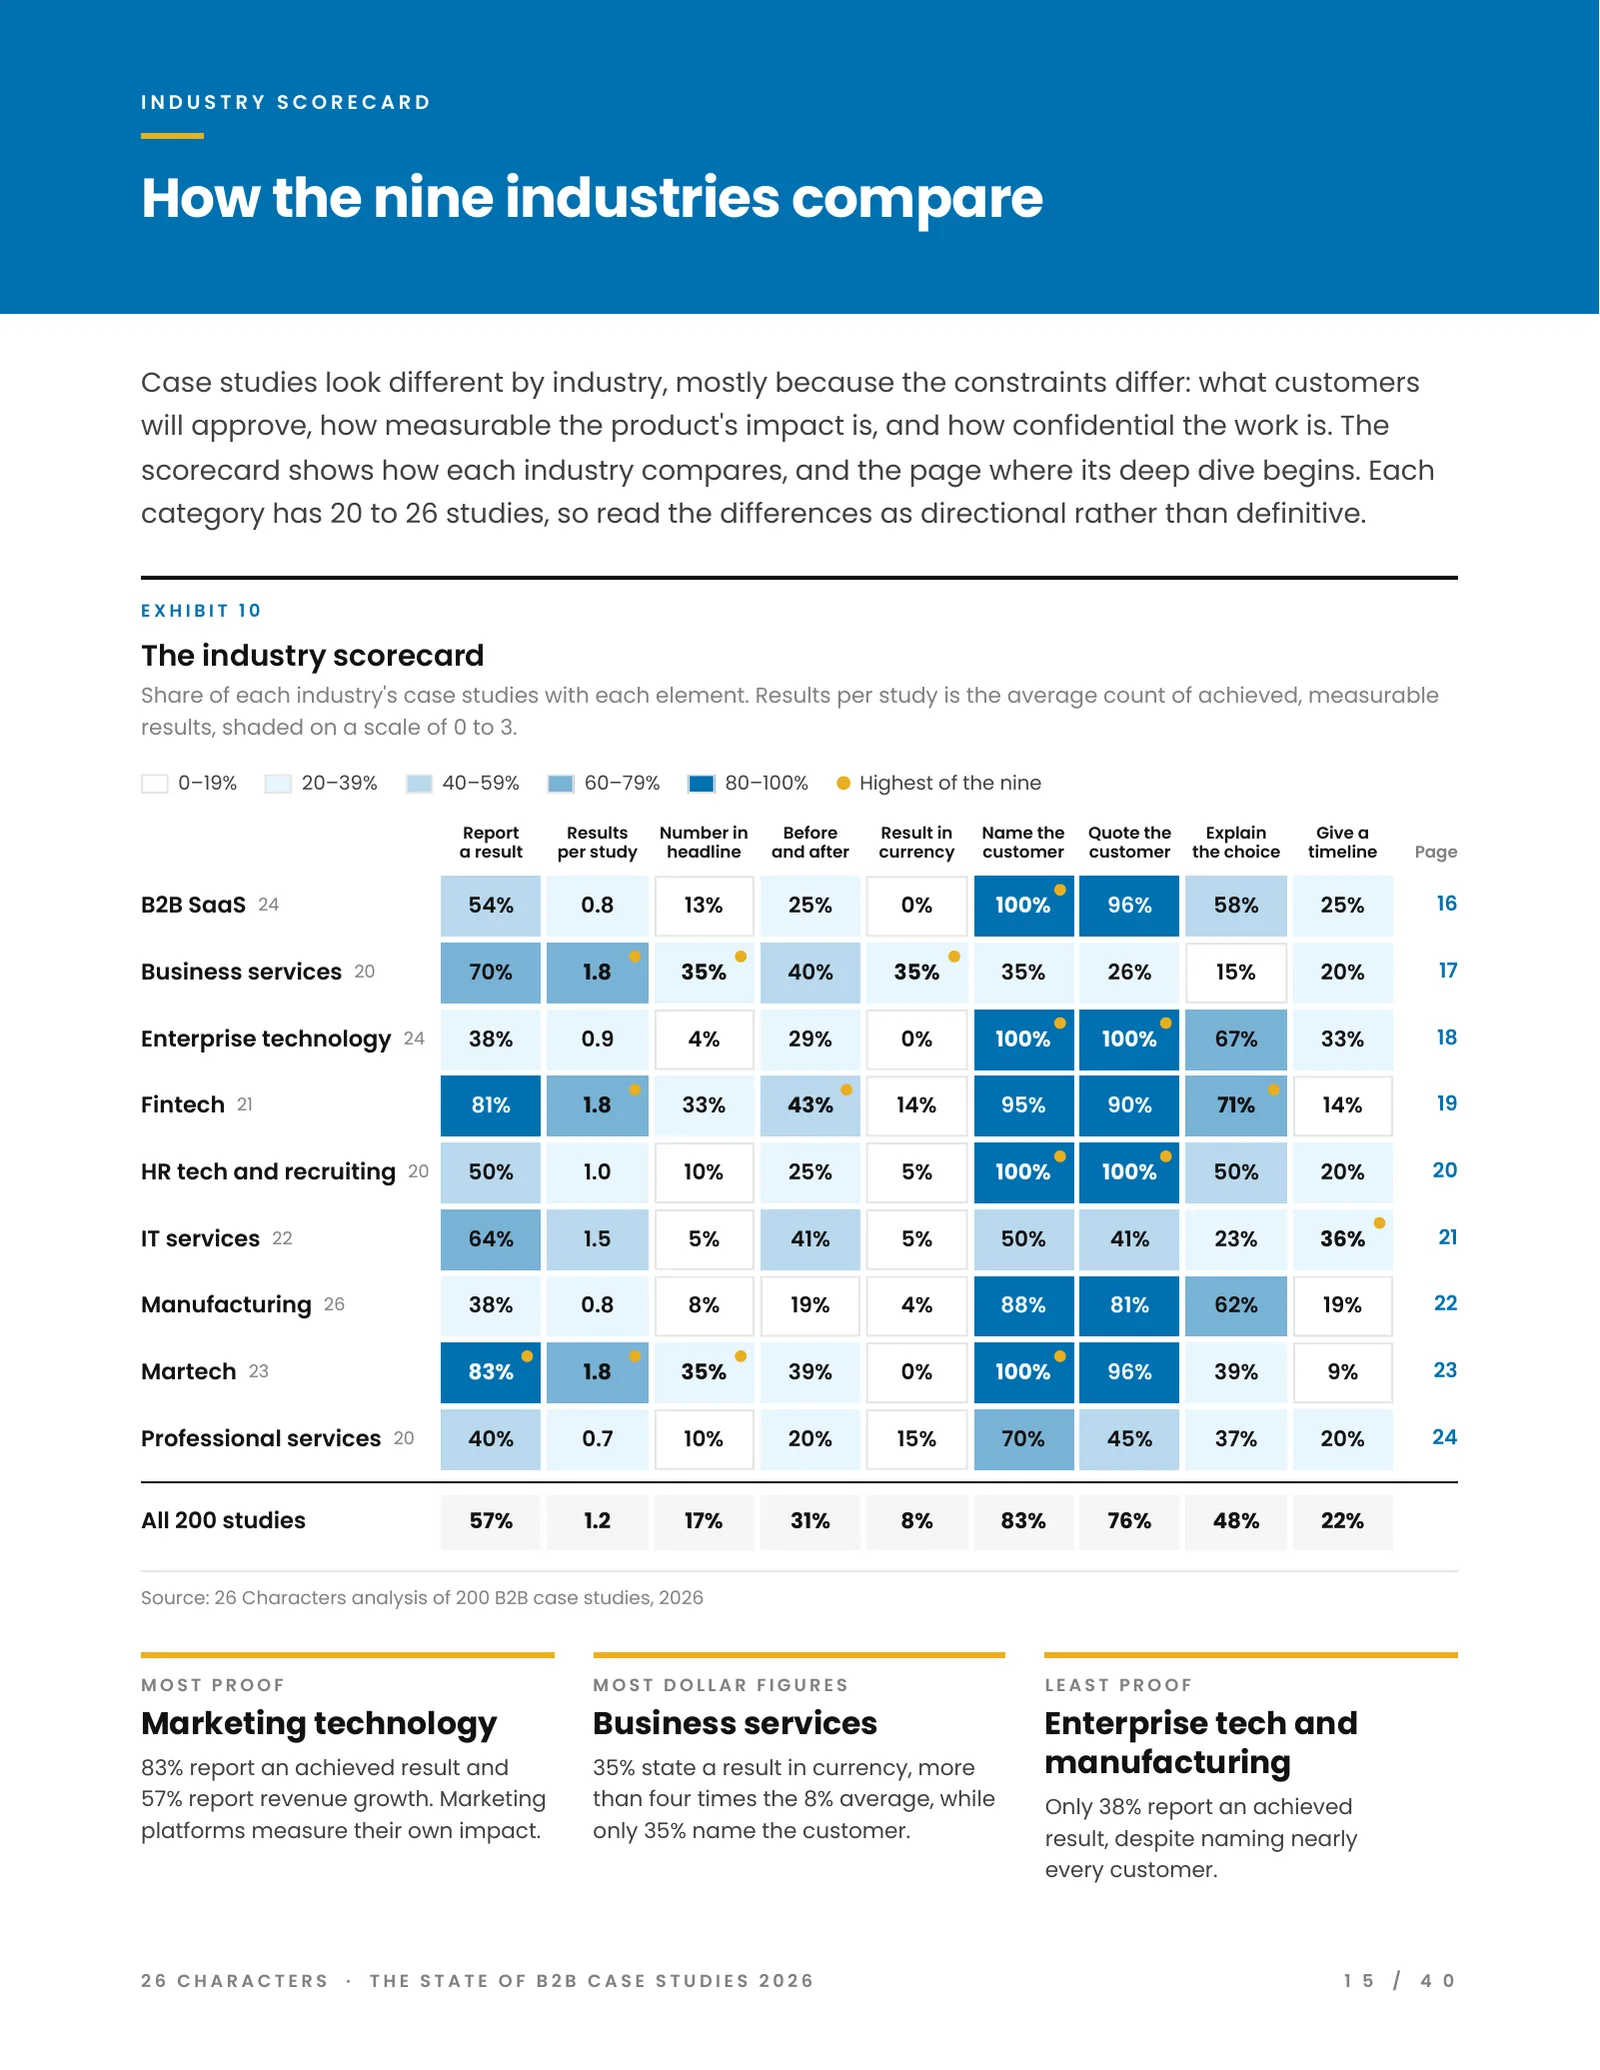
Case studies look different by industry because the constraints differ: what customers will approve, how measurable the product's impact is and how confidential the work is. The scorecard compares nine industries on nine elements, from reporting a result to explaining why the customer chose the vendor. Marketing technology carries the most proof, with 83% reporting an achieved result, while enterprise technology and manufacturing report one only 38% of the time despite naming nearly every customer. Business services states a result in dollars in 35% of studies, more than four times the 8% average, yet names the customer in just 35%.
 Click to enlarge
Most of the fixes sit within the marketing team's control.
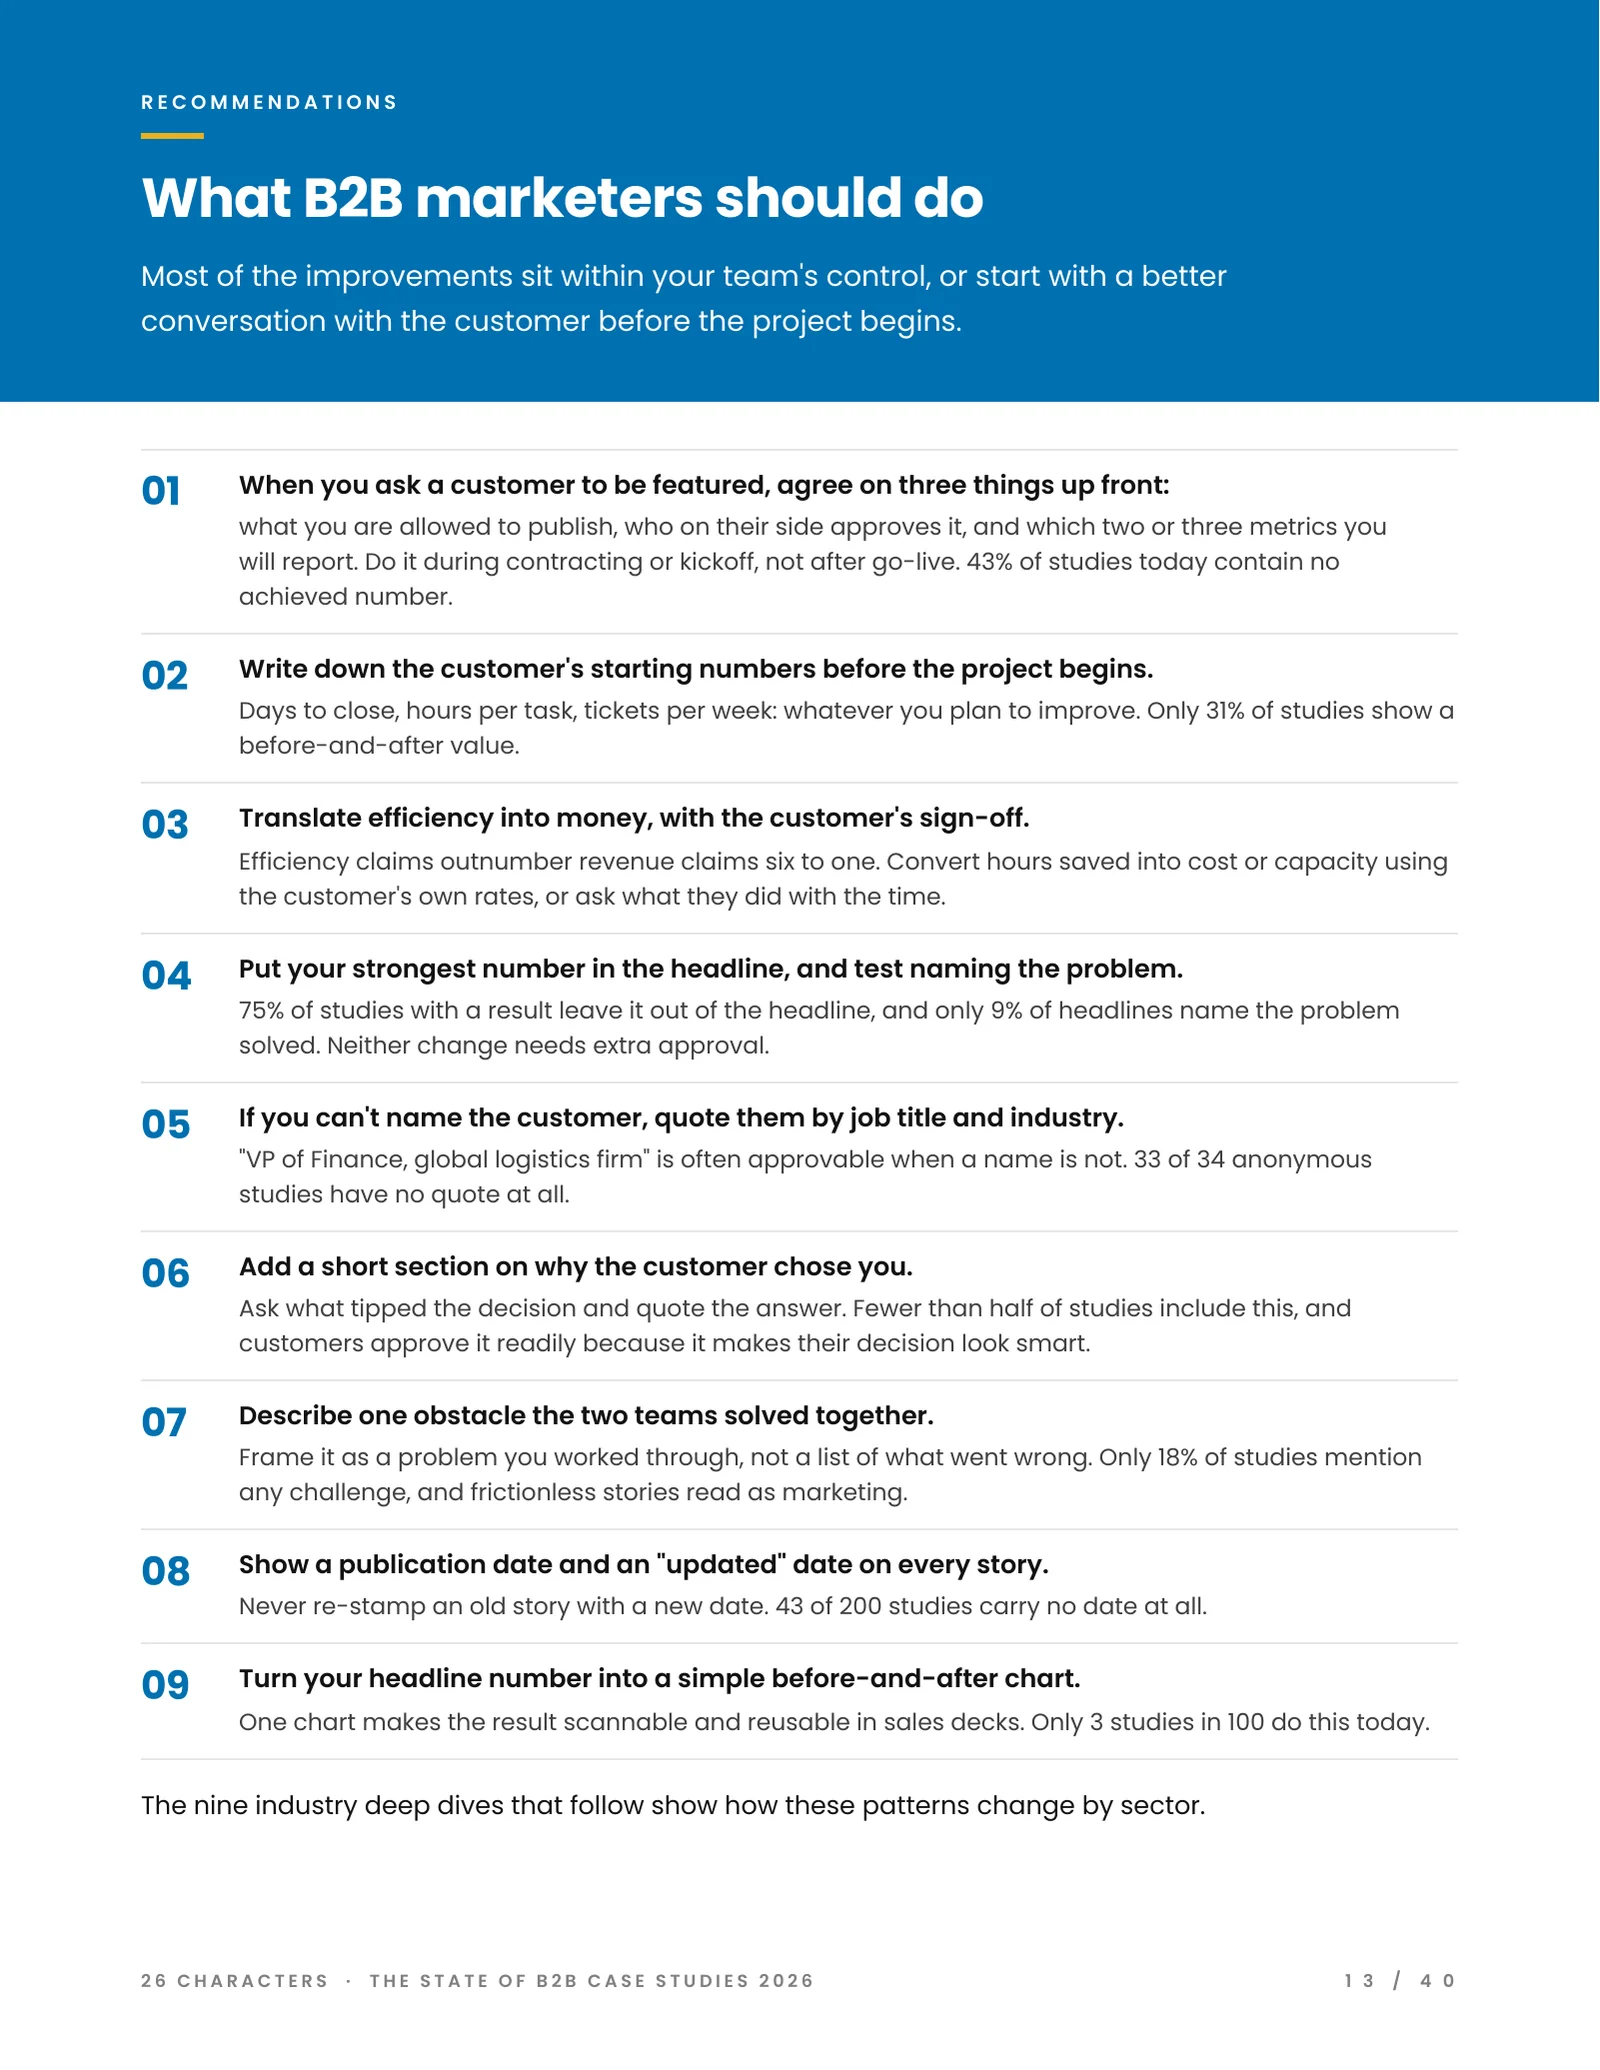
The findings turn into nine actions, each tied to a number from the study. Agree with the customer up front on what you can publish, who approves it and which two or three metrics you will report. Write down the starting numbers before the project begins, since only 31% of studies show a before-and-after value. Then put your strongest number in the headline and show a publication date on every story.
Other free reports.
Connect with 26 Characters.
Want to see how your own case studies measure up? Start with a free diagnostic.